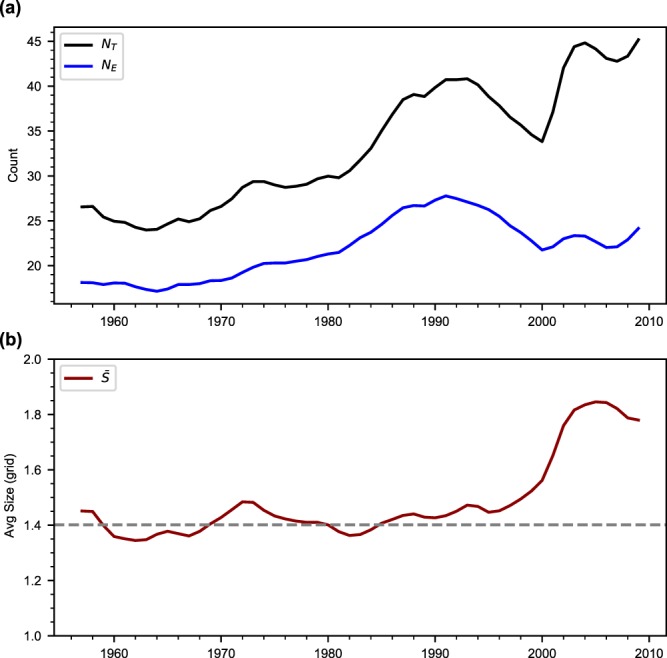
Figure 1.

Temporal variation of extreme rainfall events over Central India. Smoothed time series of: (a) total number of 1° × 1° grids with extreme rainfall in a summer monsoon season (NT) and the number of extreme rainfall events (NE); (b) average size () of extreme rainfall events. The dashed line is 1951–1980 period average. Time series shown are 11-year moving averages smoothed using a 3 point (0.25, 0.5 and 0.25) weighted averaging to highlight the long-term variations. Time series (without smoothing) of NT and show a significant increasing trend at the 99% confidence level based on the Mann-Kendall test. The NT is equivalent to the count of extreme events reported in the past studies4,6,18. The analysis used the gridded rain gauge data of the India Meteorological Department31.
