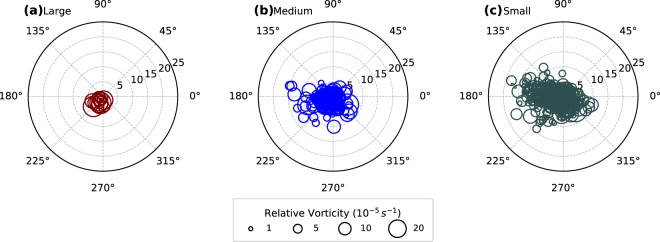
Figure 3.
Spatial distribution of rainfall extremes with respect to monsoon low pressure systems (LPSs). Relative locations of the centre of mass of (a) large, (b) medium and (c) small Extreme Rainfall Events (EREs) with respect to the LPS centre (taken as position of the 850 hPa relative vorticity maxima). The origin of the polar plot and bubbles represent the LPS centre and the centre of mass of EREs respectively. The radial distance from the origin is in degrees. The area of the bubble is directly proportional to the relative vorticity (850 hPa) at the LPS centre. For this analysis, the LPSs over the Bay of Bengal and Central India (10°–27°N, 75°–95°E) are considered for the period 1979–2012. The archived LPS track data by Hurley and Boos23 is used for this analysis.

