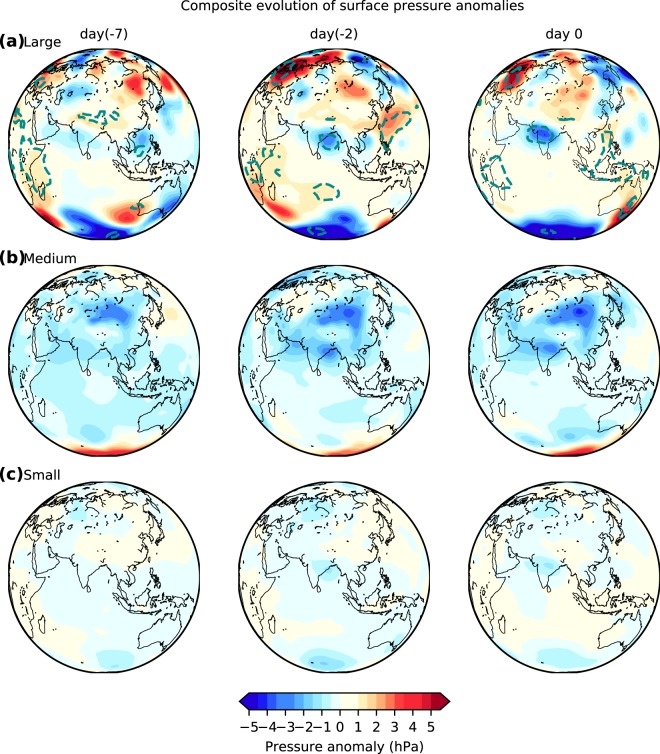
Figure 4.
Surface pressure anomalies associated with rainfall extremes. Composite evolution of daily surface pressure anomalies for (a) large (b) medium and (c) small extreme rainfall events. Here, day 0 is the day of the Extreme Rainfall Event; day(−2) and day(−7) respectively indicate two and seven days before the event. The dotted contours indicate the regions that have significant anomalies at the 99% confidence level (using t-test). The data is obtained from the National Centers for Environmental Prediction (NCEP) reanalysis for the period 1951–2015.

