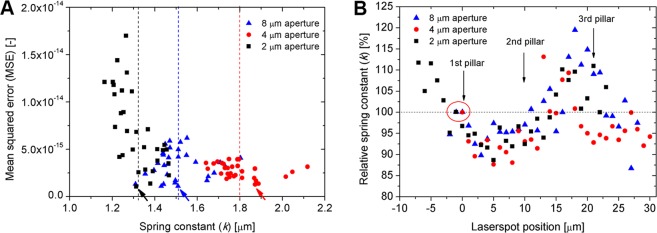
Figure 8.
(A) Mean squared error (MSE) calculated between the raw thermal spectrum and its Lorentzian fit, as functions of the calculated spring constant (data corresponds to Fig. 5B). The arrows indicate the selected reference values used for rescaling the datasets, as presented in Fig. 8B. The dashed lines represent the mean of each distribution. (B) Relative spring constant values as functions of the laser position. The following values were used as a reference (100%) for calculations: 1.51 N/m for 8 µm, 1.87 N/m for 4 µm and 1.31 N/m for 2 µm aperture, respectively.

