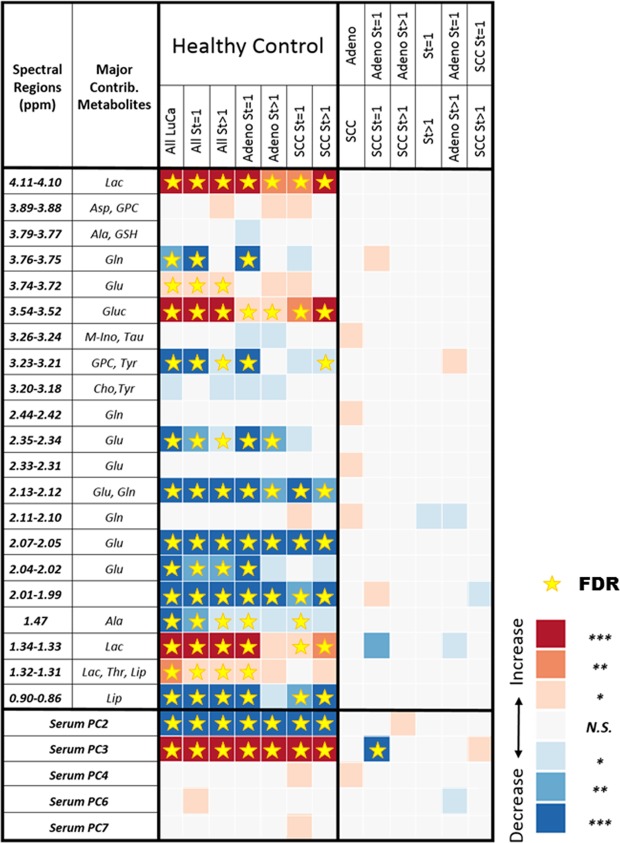
Figure 1.
Serum MRS identification of LuCa from controls and differentiation among LuCa types and stages. LuCa groups vs. healthy controls (central column) and various LuCa types and stage groups (right column) were compared with two-tailed Student’s t-test or Mann-Whitney-Wilcoxon test. “Increase” indicates that the values are higher in the lower group compared to the upper group; “Decrease”, indicates the opposite. For instance, the first red square in the table shows that the group of all LuCa samples presented significantly higher serum lactate (Lac, 4.11–4.10 ppm) than the group of healthy controls. See Supplementary Table S1 for sample numbers in each group, and see text for significance notation details. Abbreviations: Ala, alanine; Asp, aspartate; Cho, choline; Glc, glucose; Gln; glutamine; Glu, glutamate; GPC, glycerophosphocholine; GSH, glutathione; Lac, lactate; Lip: lipids; M-Ino, myo-inositol; PC, principal component; St, stage; Tau, taurine; Thr, threonine; Tyr, tyrosine; Val, valine. The notations of statistical significance levels are: “*”p < 0.05; “**”p < 0.005; and “***”, Bonferroni-corrected thresholds of statistical significance of p < 0.0016 or p < 0.0063 for 32 individual regions or 8 PCs, respectively. The star symbols denote statistical significances after FDR calibration.

