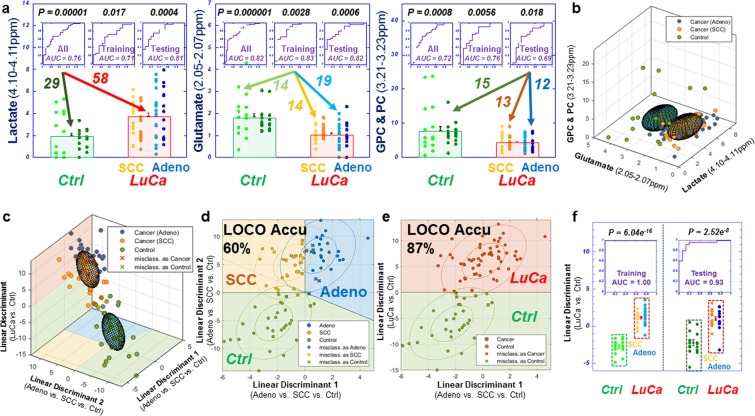
Figure 2.
Comparisons between analyses with serum MRS metabolites and analyses with metabolomics. (a) Panels of three metabolites that can significantly differentiate LuCa from control groups both for all the tested Stage I, SCC (n = 27) and Adeno (n = 31), and control (n = 29) cases, and for the Training and Testing cohorts, separately. (b) The 3D ellipsoids generated from the three panels in (a) that cover the volume of 3D Mahalanobis distance ≤1 (one standard deviation from the centroid along each axis) from the class means for LuCa and control groups, according to the covariance matrix of all class-mean-corrected samples. (c) Two-class (LuCa vs. control) and three-class (Adeno vs. SCC vs. control) linear discriminations calculated from 19 spectral regions in Fig. 1. Misclassifications are indicated by X’s. (d,e) 2D projections for three-class and two-class LD results from (c). The ellipses represent the 2D Mahalanobis distances 1 and 2 standard deviations from the class means, respectively. Solid lines on projection planes represent active decision boundaries. Classification accuracies shown are after leave-one-out cross-validation. (f) Differentiations between LuCa and control cases calculated with LD canonical correlation analysis for the Testing cohort by using analytic parameters obtained from the Training cohort.

