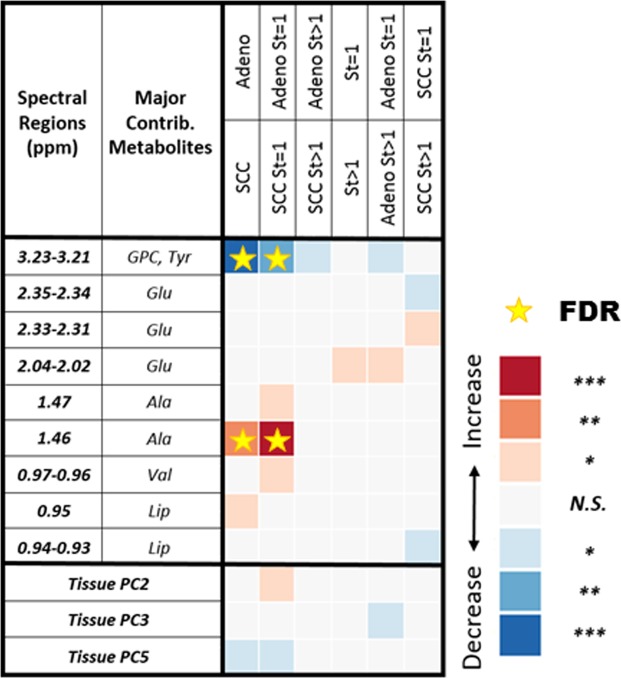
Figure 3.
Tissue MRS differentiations among LuCa types and stages. After pathology calibrations for the tissue MRS spectral data, various LuCa types and stage groups were compared with two-sided Student’s t-test (for normal spectral region distributions) or Mann-Whitney-Wilcoxon test (for non-normal spectral region distributions). “Increase” indicates that the values are higher in the lower group compared to the upper group; “Decrease”, indicates the opposite. For instance, the first blue square in the table shows that the group of SCC samples presented significantly lower spectral intensity in the glycerophosphocholine and tyrosine region. See text for significance notation details, and see Supplementary Table S1 for sample numbers in each group. Abbreviations: Ala, alanine; Glu, glutamate; GPC, glycerophosphocholine; Lip: lipids; PC, principal component; St, stage; Tyr, tyrosine; Val, valine.

