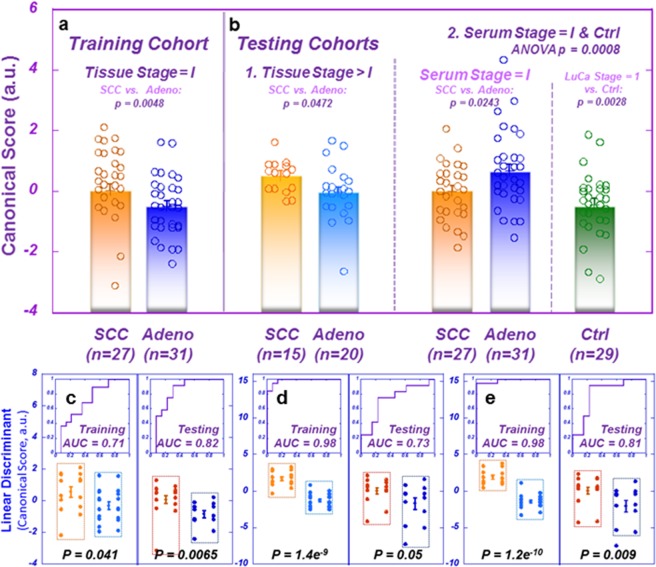
Figure 5.
Differentiation between LuCa types and stages with tissue-derived serum metabolomic profiles. (a) Training cohort: ANOVA comparison between canonical scores (arbitrary units, a.u.) of Stage I LuCa cases SCC (n = 27; Mean = 0.033 ± 0.208) vs. Adeno: (n = 31; Mean = −0.503 ± 0.194). (b) Testing cohorts: (1) ANOVA comparison between canonical scores (a.u.) of tissues from LuCa cases of Stages II, III, and IV SCC (n = 15; Mean = 0.495 ± 0.211) vs. Adeno (n = 20; Mean = −0.038 ± 0.182) and (2) ANOVA comparison between canonical scores (a.u.) of serum PCs calculated with tissue PCA loadings for Stage I cases SCC (n = 27; Mean = −0.010 ± 0.213) vs. Adeno (n = 31; Mean = 0.682 ± 0.199) vs. controls (n = 29; Mean = −0.436 ± 0.206). Given our hypothesis from the tissue training cohort result that mean canonical score values were higher for SCC than for Adeno, a one-tailed test was used for the tissue testing cohort only. (c,d) Linear discriminant canonical correlation analyses with the 19 spectral regions (cf. Fig. 1), for tissue and serum MRS data of the Training cohort, respectively. The capabilities of the resulting canonical scores in differentiating SCC from Adeno groups were presented with the results obtained from the Testing cohort. (e) Linear discriminant canonical correlation analyses including both tissue and serum results (from c,d), increased statistical significance for SCC and Adeno differentiations.

