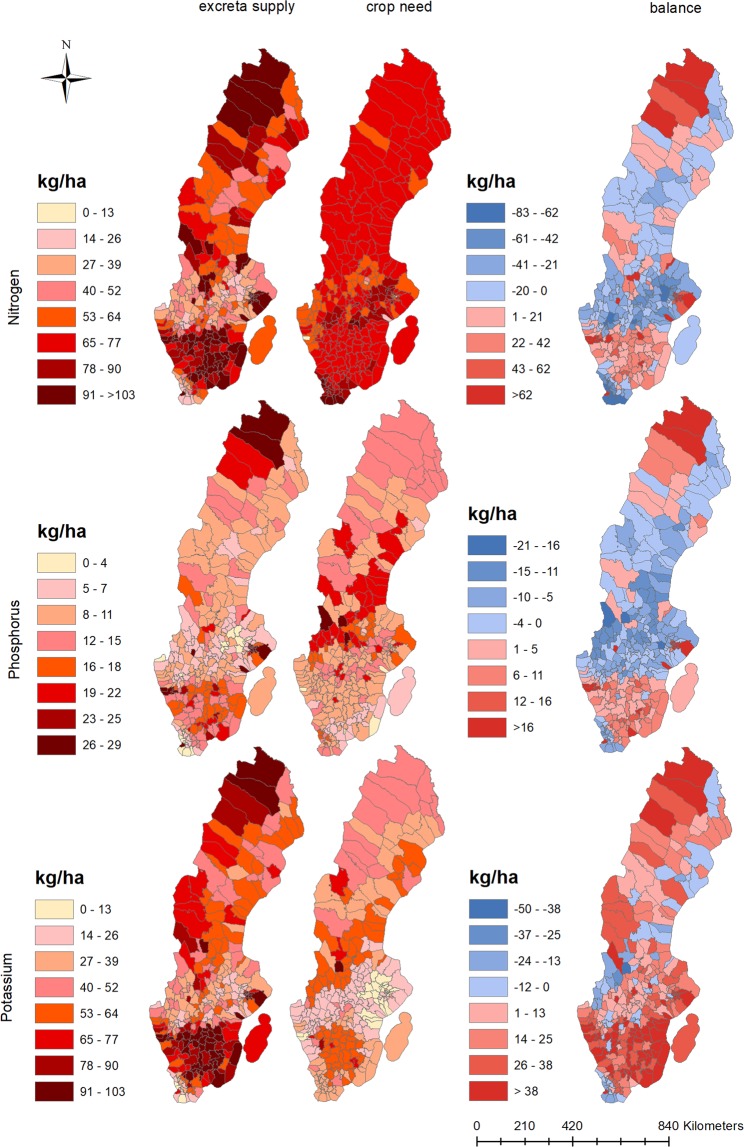
Figure 2.
Spatial distribution of nutrients in excreta, crop nutrient needs, and nutrient balances of Swedish municipalities. The top panel represents N, the middle P, and the bottom K distributions. The right-side balance maps are created by subtracting crop nutrient need (middle) from excreta nutrient supply (left). Note that although the color scales are the same for all three nutrients, the values associated with each color are not (e.g., N values are much higher than for P).

