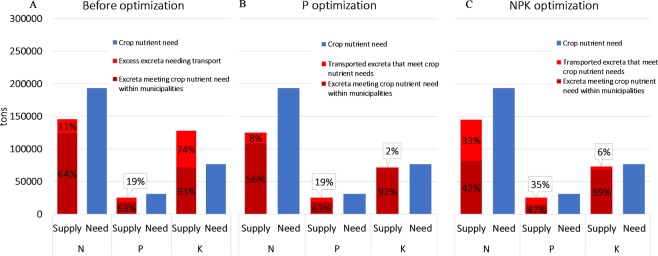
Figure 3.
Total amount of nutrients in excreta that can be recycled within municipalities and transported between municipalities to meet crop needs. (A) The amount of crop nutrient needs that could theoretically be met by recycling before any optimization is run. (B) The amount of crop nutrient needs that could be met based on the redistribution made by the P optimization model. (C) The amount of crop nutrient needs that could be met based on the redistribution made by the NPK optimization model. Values are presented as the total amount of nutrients (y-axis) and as a percentage of total crop nutrient needs (black numbers in bars). Panels B and C only show the amount of excreta that meets crop nutrient needs, and not the surplus amounts within municipalities or resulting from excreta transport (all numbers are available in Supplementary Table S12).

