Figure 4.
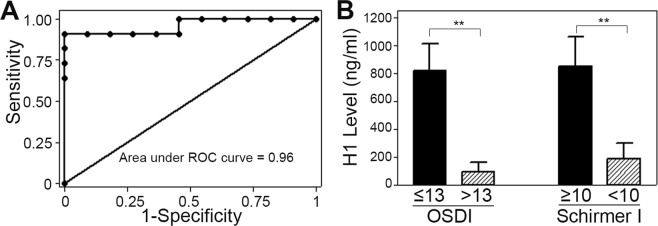
Statistical Analysis of H1 Concentration and Association with OSDI and Schirmer I. (A) ROC analysis of the sensitivity and specificity of H1 concentrations for detecting a diagnosis of ADDE in the tested population. Area under the ROC curve was 0.96 (95% CI = 0.87–1.00), consistent with the excellent ability of H1 concentration to be used to detect a diagnosis of ADDE in the studied population. (B) Testing the Ability of H1 Concentration to Detect Patients with High OSDI or Low Schirmer I values. Patients were reclassified to groups based on their OSDI scores and Schirmer I measurements. Based on OSDI classification, the H1 level was significantly lower in the high OSDI (“diseased”) than the normal group. Based on Schirmer I classification, H1 level was significantly lower in the low Schirmer I (“diseased”) than the normal group.

