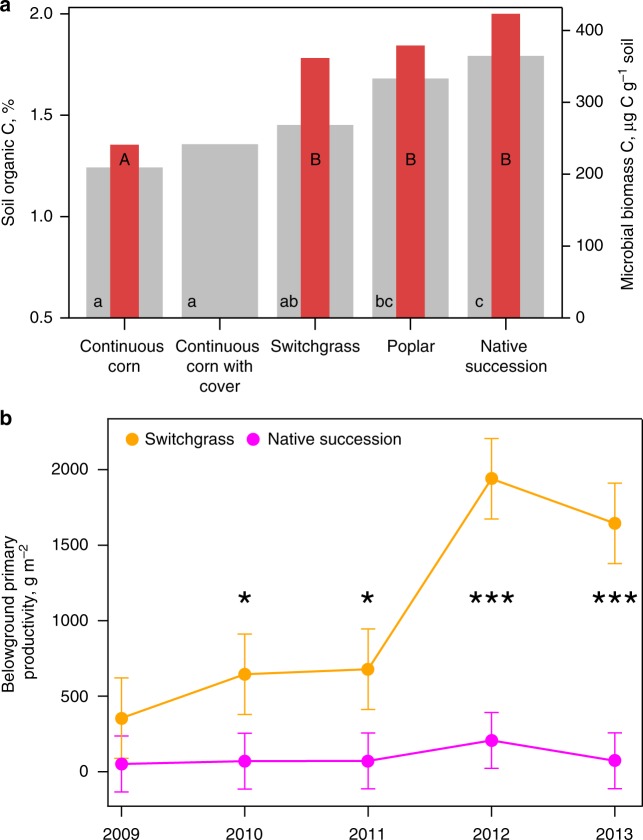
Fig. 1.
Soil organic C, microbial biomass C, and belowground primary productivity in soil of the studied cropping systems 9 years after their implementation. a Average soil organic C (gray) and microbial biomass C (red) for five studied systems (5–10 cm soil depth). Lower and upper case letters represent statistically significant differences in terms of soil organic C and microbial biomass C, respectively (p < 0.05). Standard errors are equal to 0.1% and 28.5 µg C g−1 for soil organic C and microbial biomass C, respectively. Note that microbial biomass C could not be analyzed in the continuous corn with cover crop system. b Average belowground primary productivity for switchgrass and native succession vegetation systems from 2009 (the year of establishment) till 2013 (0–10 cm soil depth). Error bars represent s.e.m. Years when switchgrass belowground primary productivity exceeded that of native succession vegetation are marked with *p < 0.1 or ***p < 0.01. Source data are provided as a Source Data file

