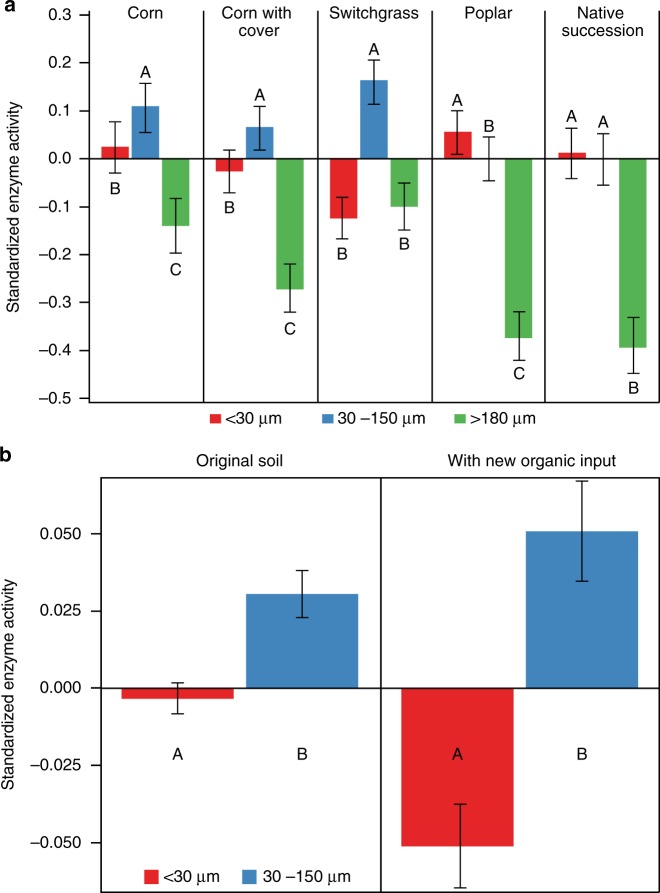
Fig. 4.
Standardized enzyme activities in soil micro-sites with prevalence of pores of three size groups (<30 µm, 30–150 µm, and >180 µm). a Enzyme activities from soil slices not subjected to incubations with fresh C inputs. Shown are means across all studied enzymes. Error bars are s.e.m. (based on 139 zymography layers from 13 soil cores). Letters within each cropping system mark statistically significant differences among pore size classes (p < 0.05). b Enzyme activities from slices subjected and not subjected to incubations with fresh nutrient inputs; shown are means across all systems and enzymes. Error bars are s.e.m. (based on 88 and 14 zymography layers without and with new organic inputs, respectively, from 10 soil cores). Letters mark significant differences between enzyme activities in localities with <30 and 30–150 µm pores (p < 0.05). Summary data are provided as a Source Data file

