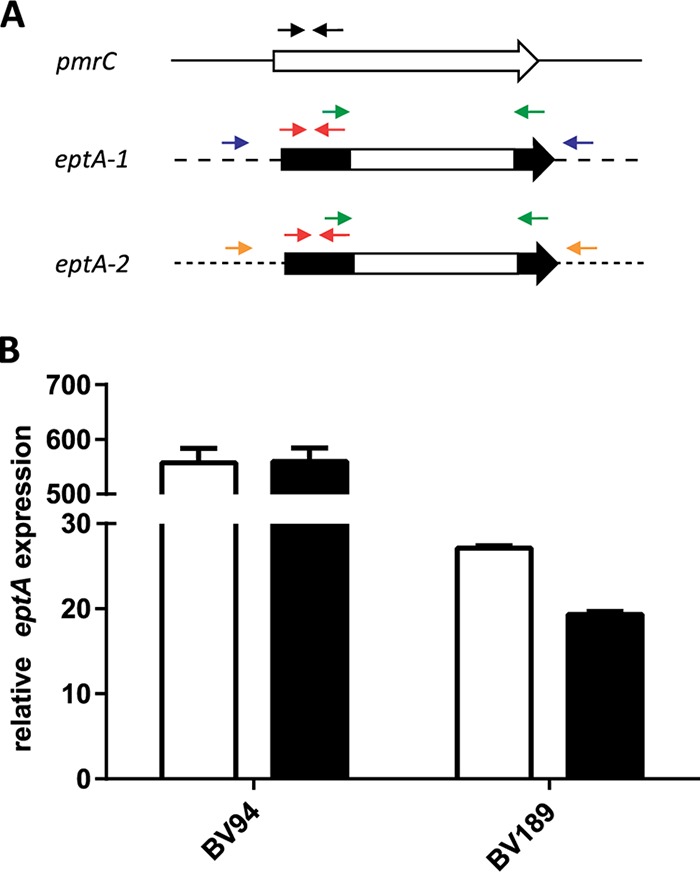
FIG 2.

Discrimination and quantification of pmrC and eptA. (A) Schematic representation of differences in the pmrC, eptA-1, and eptA-2 coding sequence. Primers marked by black (oVT162/oVT163) and red (oVT164/oVT165) arrows were used to detect pmrC and eptA in qRT-PCR experiments, respectively. The primers marked by green arrows (oVT152/oVT153) were used to genotype the eptA isoforms. Primers marked by blue (oVT198/oVT199) and orange (oVT201/oVT202) arrows were used to discriminate eptA-1 and eptA-2, respectively. (B) Expression levels of eptA were quantified by qRT-PCR in colistin-resistant A. baumannii isolates BV94 and BV189 (white bars) and their ΔpmrA mutants (black bars). The expression levels were normalized to the pmrC expression in the ATCC 17978 reference strain.
