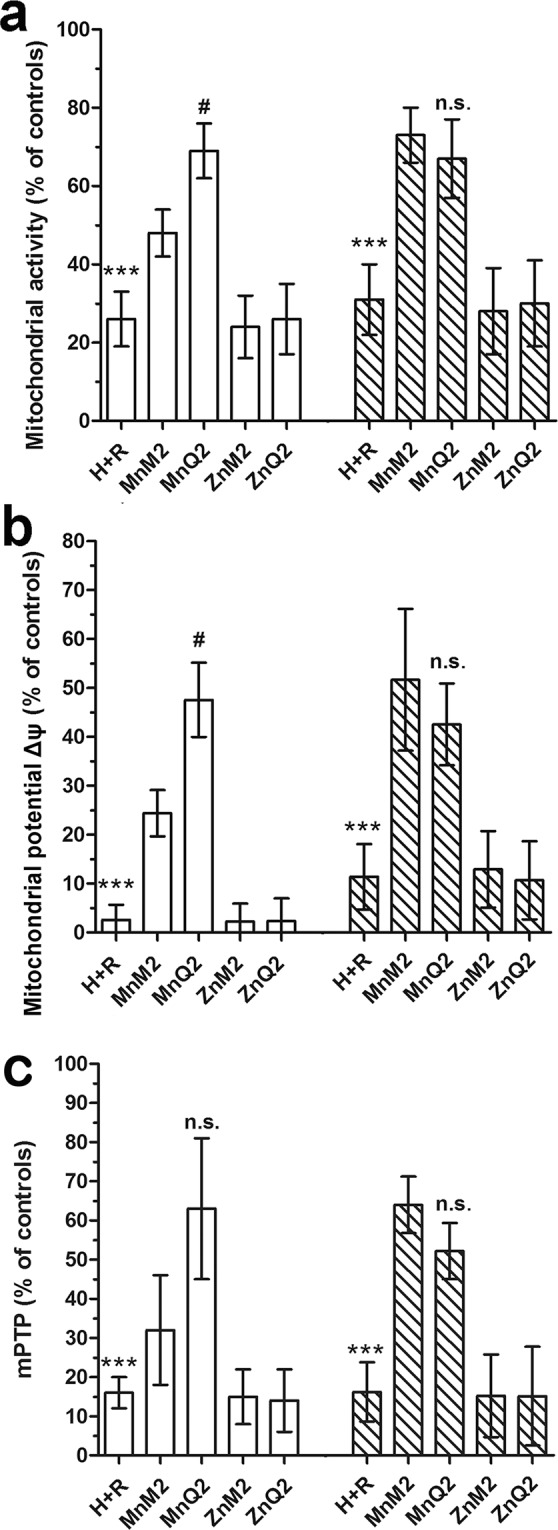
Figure 8.

FACS analysis of mitochondrial activity by RSZ (a), of mitochondrial membrane potential (Δψ) by TMRM (b) and of mitochondrial transition pore opening (mPTP) by extinction of calcein fluorescence, evaluated at 1 h (open columns) and 2 h (striped columns) and expressed as percent changes of the untreated controls. All these parameters were decreased by H + R and significantly increased by MnM2 and MnQ2. At the shorter time point (1 h), MnQ2 was more effective than MnM2. ***p < 0.001 vs. controls, MnM2 and MnQ2; (one-way ANOVA); #p < 0.05, n.s. not significant vs. MnM2 (Student’s t test).
