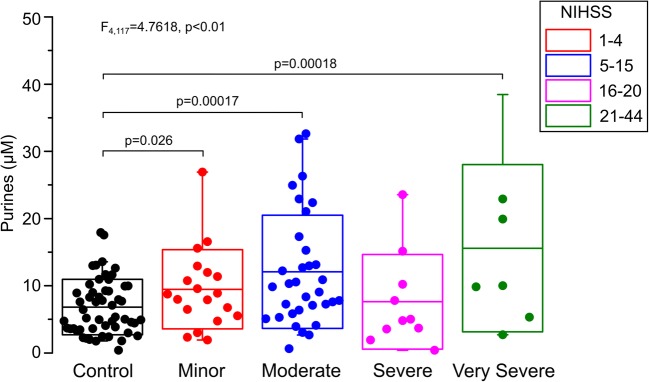
Fig. 4.
Purine levels measured in stroke patients grade with severity of stroke classified by NIHSS. A five-level single factor ANOVA shows that the purine levels in controls and stroke groups are significantly different. Pairwise t tests show that purine levels in minor, moderate and very severe stroke patients are significantly elevated relative to controls. Box plots show mean and SD, whiskers are 5–95 percentiles

