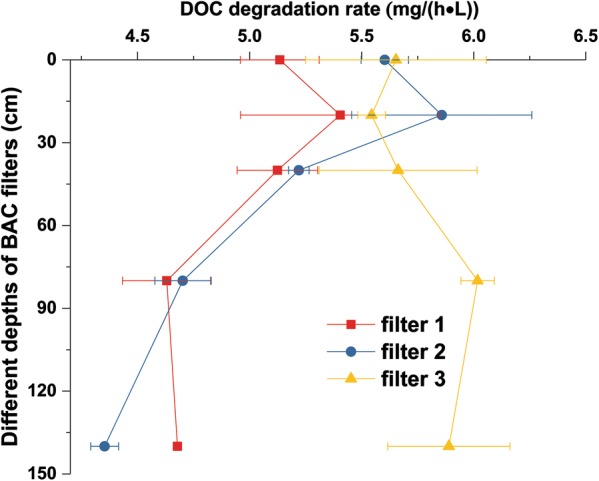
Fig. 3.

Microbial DOC degradation rates as a function of depth in the BAC filters. Depth 0 corresponds to the top of the filter bed. Data depict means and standard deviations of three parallel incubations. Filters 1 and 2 are filled with granular activated carbon whereas filter 3 is filled with extruded activated carbon
