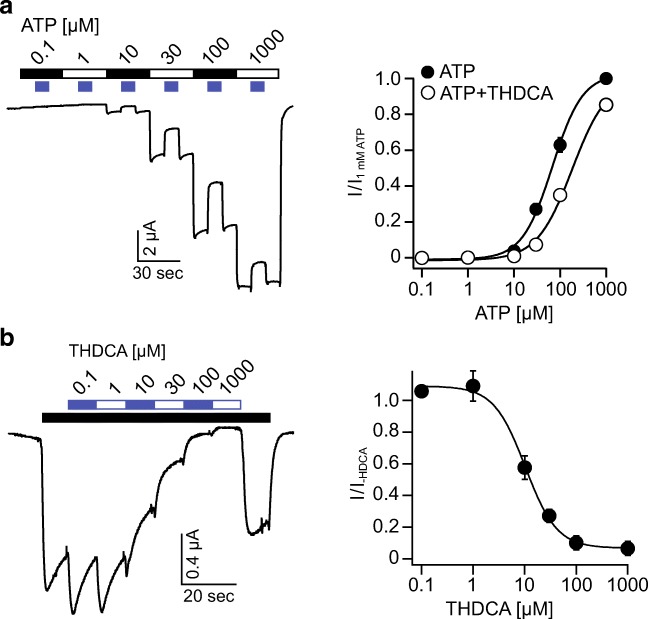
Fig. 5.
THDCA decreases the ATP affinity of rP2X2 and inhibits P2X2 currents in a concentration-dependent manner. a Left, representative current trace showing the application of increasing ATP concentrations and intermitted co-application of 20 μM THDCA to rP2X2 expressed in Xenopus laevis oocytes. Right, concentration-response curve for ATP in the absence or presence of 20 μM THDCA normalized to the application of 1 mM ATP alone, n = 12. b Left, representative current trace showing the activation of rP2X2 by ATP (10 μM) and the inhibitory effect of increasing concentrations of THDCA (white-blue bar). Right, concentration-response curve of THDCA in the presence of 10 μM ATP normalized to the current in absence of THDCA, n = 10. Error bars represent S.E.M.

