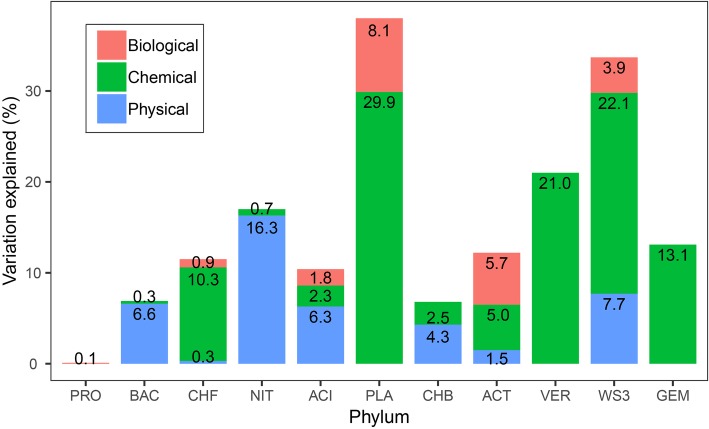
Figure 4.
The proportion of the variance in bacterial phylum relative abundance explained by physical, chemical, and biological variables. For simplicity, the pure effects of the three components in predicting the relative abundance are shown, but not the joint effects or unexplained variances. An alternative version of this figure showing the unique and shared variance of each group can be found in Supplementary Figure S1.

