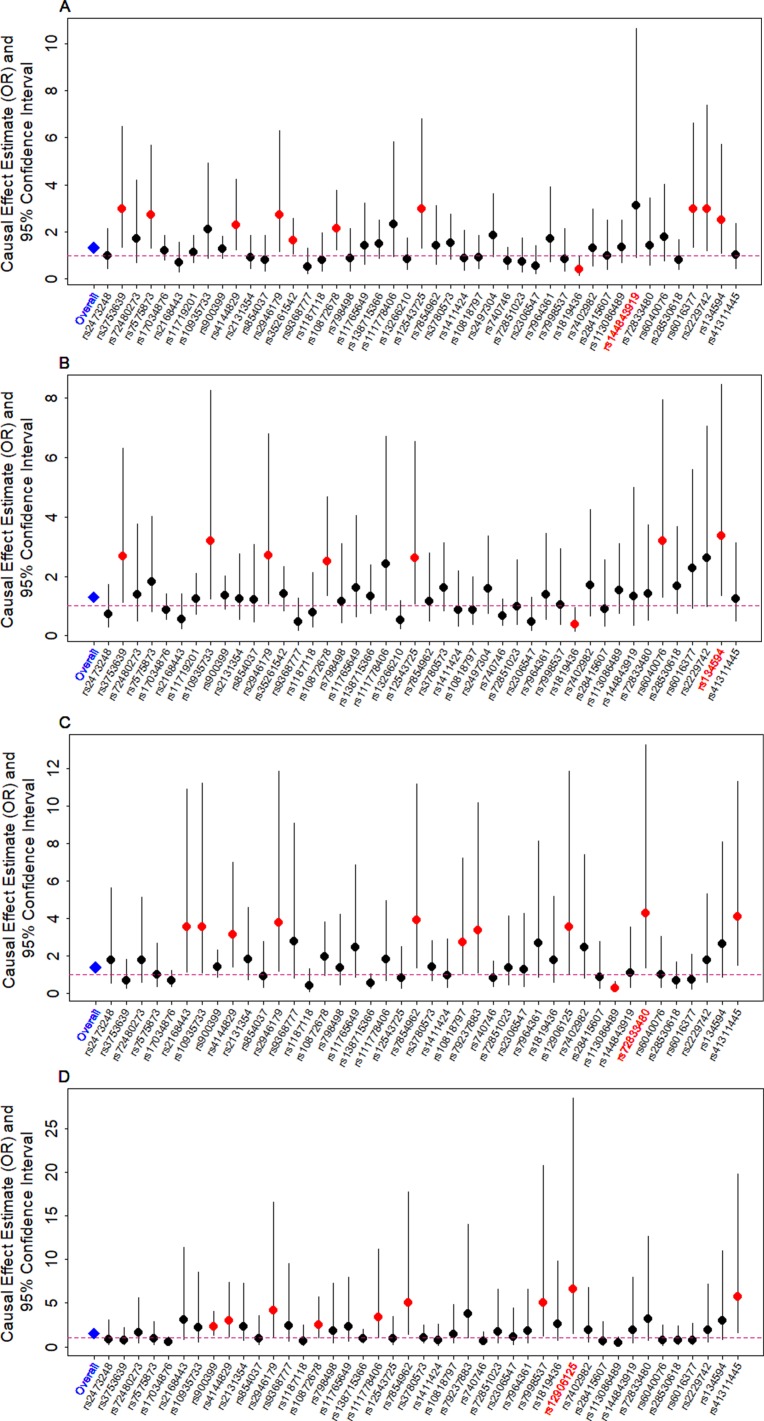
Figure 3.
Causal effect estimates and 95% confidence intervals for lower birth weight on (A) CAD, (B) MI, (C) T2D, and (D) T2D_BMI. Estimations are carried out either using all SNPs (first column on x-axis) or using individual SNPs (the remaining columns on x-axis) based on Equation (14) in Text S3. Dot size is proportional to the effect size estimates, while dot color represents significance (p < 0.05 are highlighted in red). SNP that yields the largest causal effect estimate is also highlighted in red (x-axis).

