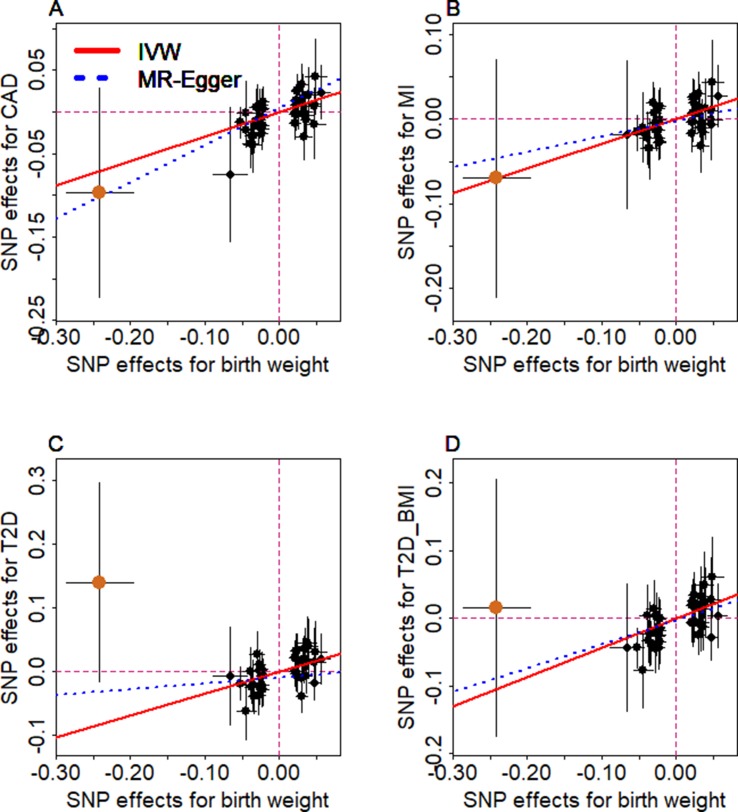
Figure 4.
Relationship between the effect size estimates on lower birth weight (x-axis) and the effect size estimates on diseases (y-axis) for the 47 SNPs that serve as instrumental variables. Examined diseases include (A) CAD, (B) MI, (C) T2D, and (D) T2D_BMI. 95% confidence intervals for the estimated SNP effect sizes on disease are shown as vertical black lines, while the 95% confidence intervals for the estimated SNP effect sizes on birth weight are shown as horizontal black lines. The vertical and horizontal red dotted lines represent zero effects. The slope of fitted lines represents the estimated the casual effects of birth weight on the corresponding disease obtained using either the random-effects IVW method (red solid lines) or the MR-Egger regression (blue dotted lines). SNP outlier rs13875366 (chocolate dot) was not included in MR-Egger regression to avoid outlier influence. Due to the inclusion of an intercept in the MR-Egger regression, the fitted lines by MR-Egger regression (blue dotted lines) do not necessarily pass the origin.

