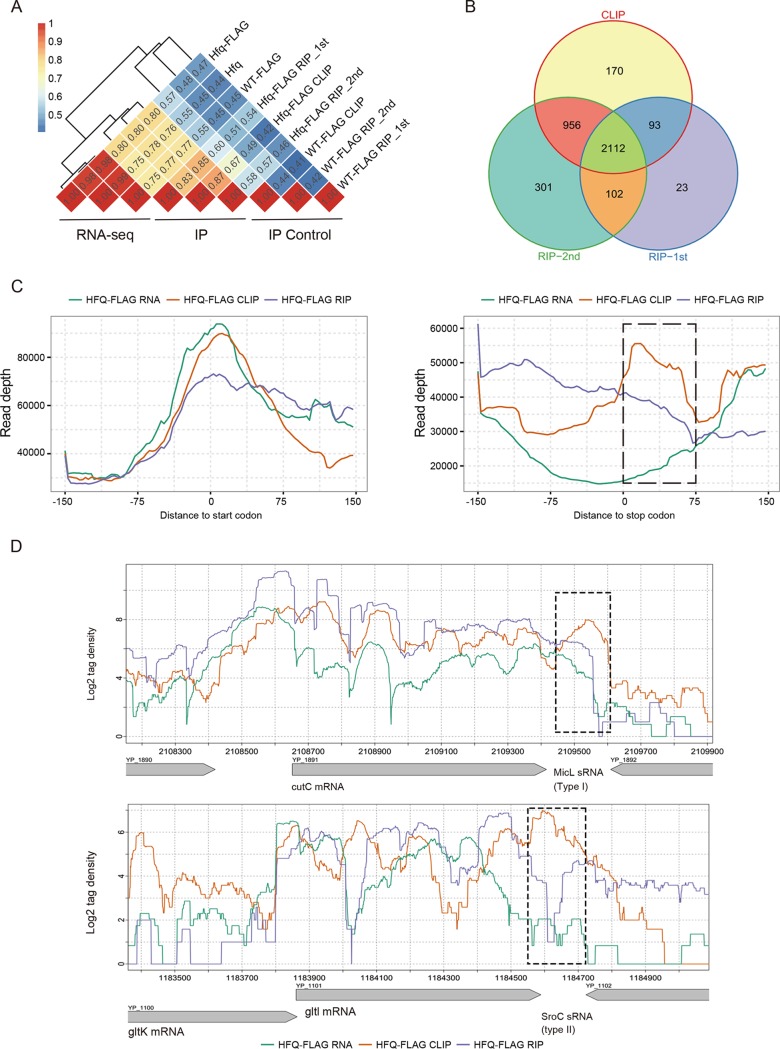
FIG 2.
RIP-seq experimental confirmation of the global binding properties of Hfq. (A) Pearson correlation analysis of detected gene abundance from RNA-seq (one set), CLIP-seq (one set), and RIP-seq (two sets) experiments using different strains. RNA-seq was performed with three strains. CLIP-seq and RIP-seq were performed with two strains (Hfq-FLAG and WT-FLAG), and WT-FLAG was used as a control. (B) Venn diagram showing the overlapping Hfq-bound mRNAs and sRNAs among three different immunoprecipitation experiments. (C) Read distribution around the 5′ leader region and the 3′ region from the CLIP-seq and RNA-seq data and one set of RIP-seq data. The left panel shows 5′ leader regions, and the right panel shows 3′ leader regions. The black dashed box indicates the region downstream of the stop codon and enriched in CLIP peak. (D) Read density illustration of two major sRNA types transcribed from the 3′ region of mRNA. The top panel shows a type I sRNA, and the bottom panel shows a type II sRNA. The black dashed box shows the locations of predicted sRNAs.

