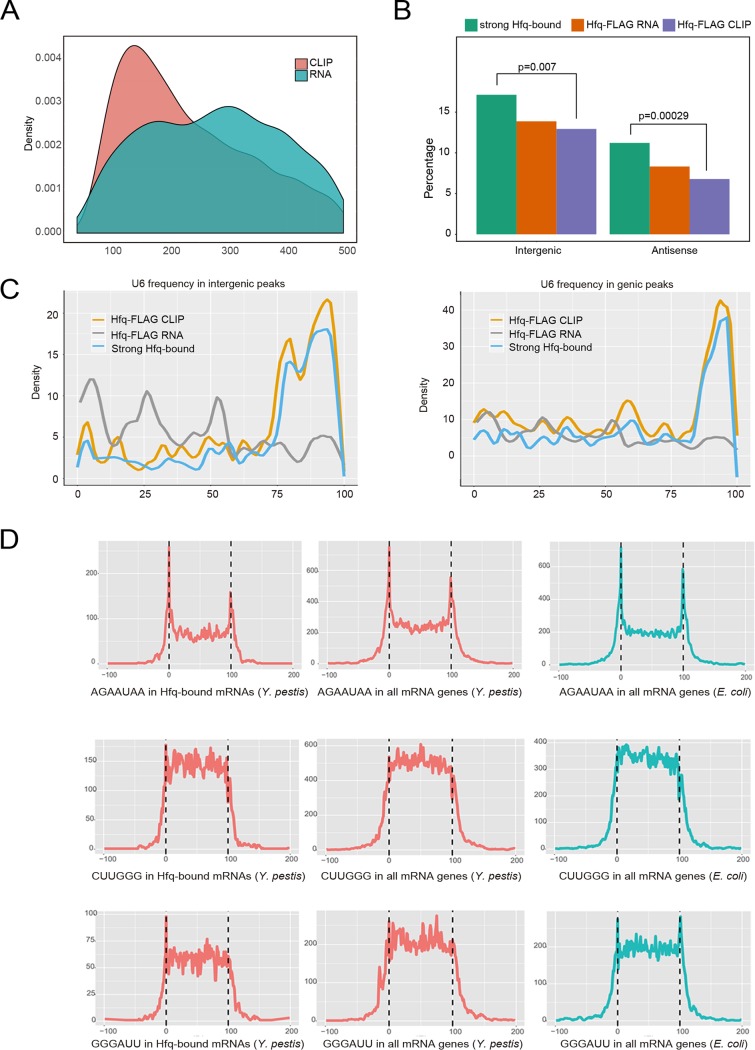
FIG 3.
Hfq binding site and motif distribution in the coding and noncoding regions. (A) Peak length distribution of CLIP-seq and RNA-seq experiments. (B) Bar plot showing the percentage of intergenic and antisense peaks in RNA-seq, CLIP-seq, and strong Hfq-bound peaks. The P values (Fisher’s exact test) are shown to illustrate the enrichment of peaks in the antisense and intergenic regions. (C) U6 stretch frequency and position in three classes of peaks, including all CLIP-seq peaks, all RNA-seq peaks, and strong Hfq-bound peaks. Presentation was separated by intergenic (left) and genic (right) regions. (D) Motif distribution along the Hfq-bound mRNAs (left), all mRNAs of Y. pestis (middle), and in all mRNAs of E. coli (right).

