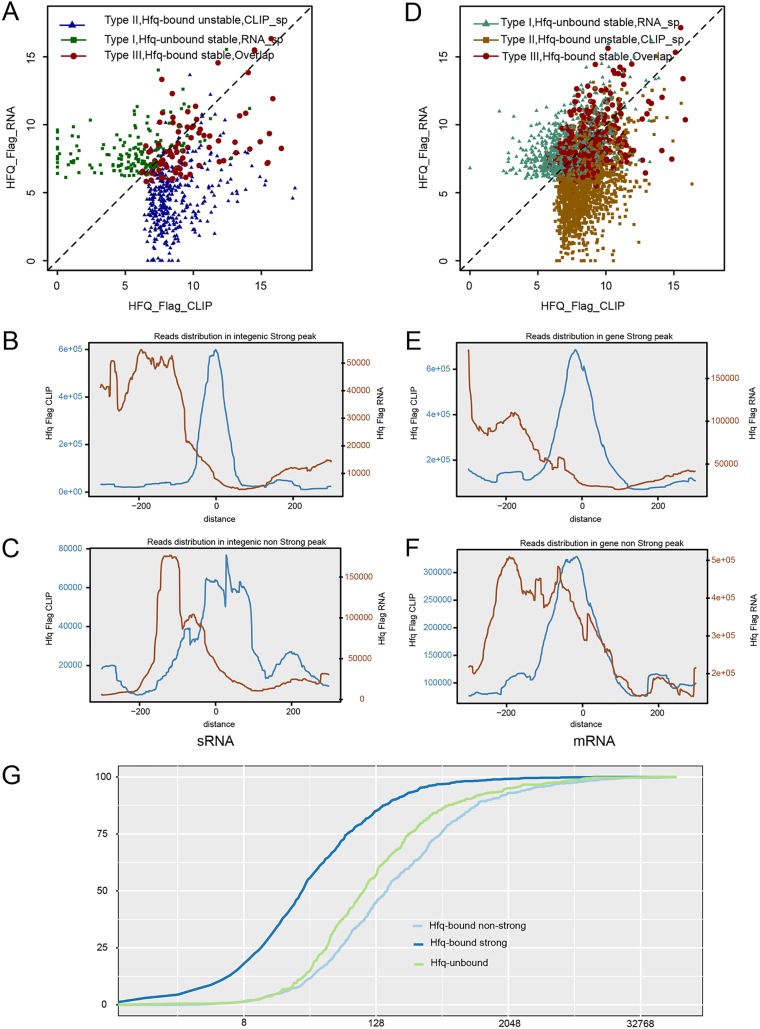
FIG 5.
Hfq-bound sRNA and mRNA segments were generally unstable. (A) Dot plot of the abundance of three classes of sRNA peaks: Hfq-unbound stable, Hfq-bound stable, and Hfq-bound unstable. (B) Distribution profiles of all CLIP-seq and RNA-seq reads around the center of Hfq-bound strong intergenic peaks. (C) Distribution profiles of all CLIP-seq and RNA-seq reads around the center of Hfq-bound nonstrong intergenic peaks. (D) Dot plot of the abundance of three classes of mRNA peaks: Hfq-unbound stable, Hfq-bound stable, and Hfq-bound unstable. (E) Distribution profiles of all CLIP-seq and RNA-seq reads around the center of Hfq-bound strong mRNA peaks. (F) Distribution profiles of all CLIP-seq and RNA-seq reads around the center of Hfq-bound nonstrong mRNA peaks. (G) Cumulative plot of gene expression abundance. Genes were divided into three groups by Hfq binding: Hfq-bound nonstrong peak genes, Hfq-bound strong peak genes, and Hfq-unbound genes.

