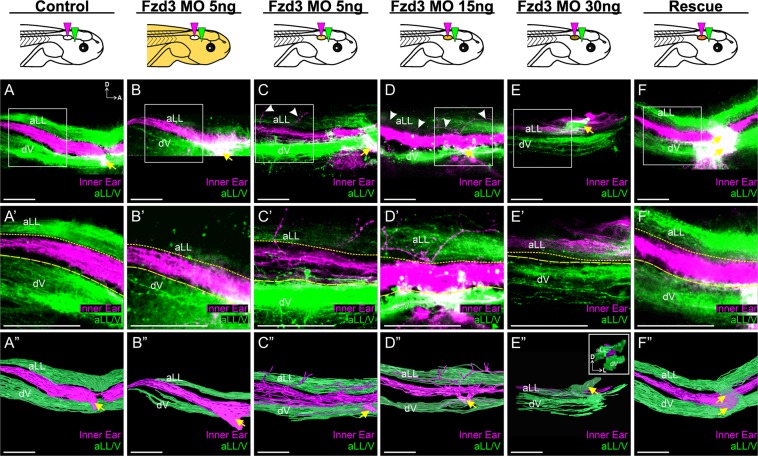
Figure 2.
Xenopus vestibular afferents display aberrant central projections in a dose-dependent manner following Fzd3 knockdown in only the ear and associated inner ear afferents. Ears from control/wild type X. laevis embryos were transplanted to replace the ear of animals injected with Fzd3 morpholino (B,B”). Note the inner ear central projections (magenta) were between the lateral line and trigeminal projections (green), comparable to control animals (A,A”). In contrast, ears from X. laevis embryos injected with various concentration of Fzd3 morpholino transplanted to replace the ear of control animals (C–E) showed variable variations in inner ear central projections that could be rescued by an addition of mouse Fzd3 mRNA (F,F”). (A) Control X. laevis (n = 6), (B) animals injected with 5 ng Fzd3 morpholino with an ear transplanted from a control animal (n = 7), (C) control animals with an ear transplanted from an animal injected with 5 ng Fzd3 morpholino (n = 6), (D) control animals with an ear transplanted from an animal injected with 15 ng Fzd3 morpholino (n = 5), (E) control animals with an ear transplanted from an animal injected with 30 ng Fzd3 morpholino (n = 2), (F) control animals with a “rescue” ear transplanted from an animal injected with 5 ng Fzd3 morpholino plus 500 pg mouse Fzd3 mRNA (n = 6). White arrowheads indicate aberrant projections. Yellow arrows indicate nerve entry points. (A’–F’) Higher magnification of boxed areas in A-F. Short-dash and long-dash yellow lines represent the approximate ventral boundary of the anterior lateral line afferent projections and dorsal boundary of the trigeminal afferent projections, respectively. (A”–F”) Three-dimensional reconstructions of entire confocal stacks in A-F. (E” Inset) Anterior view of E”. dV, descending trigeminal tract; D, dorsal; A, anterior; L, lateral. Orientation for all panels as in A, except for E” inset. Diagrams represent treatment (white, control; gold/brown, Fzd3 morpholino; orange, Fzd3 morpholino plus Fzd3 mRNA) and colored wedges represent lipophilic dye placement (magenta, inner ear; green, lateral line and trigeminal nerves). Scale bars represent 100 µm.

