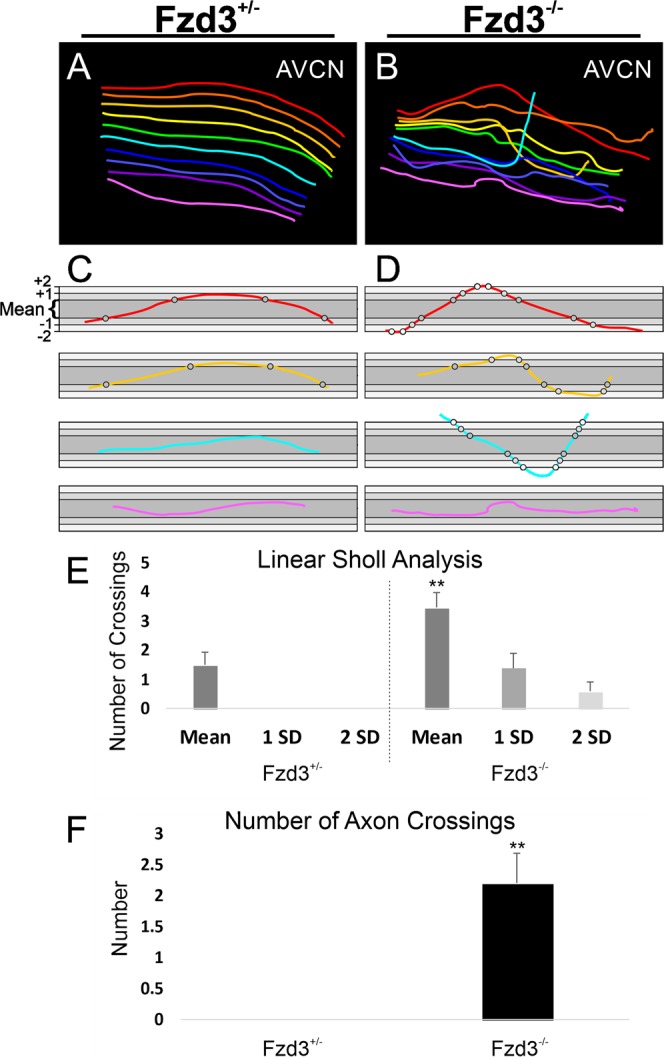
Figure 5.

Analysis of spiral ganglion neuron central projections following loss of Fzd3. (A) Reconstruction of ten approximately equally spaced afferents in Fig. 4E. (B) Reconstruction of ten approximately equally spaced afferents in 4F. (C,D) Selected individual axon tracings from a Fzd3+/− control mouse (C) and a Fzd3−/− mutant mouse (D), both at E18.5, overlaid onto boxes representing the mean dorsoventral limit of all control axons (dark gray), plus or minus one standard deviation (1 SD, medium gray), and plus or minus two standard deviations (2 SD, light gray) to display the analysis. Grayscale circles indicate mean/SD level crossings. (E) Linear Sholl analysis of 20 axons each from Fzd3+/− and Fzd3−/− mice. Bars represent means and standard error of the means for the number of times axons crossed the mean, one standard deviation (1 SD), and two standard deviation (2 SD) boundaries in (C,D). (F) Mean number of times an axon crossed over another axon from an analysis of 20 axons each from Fzd3+/− and Fzd3−/− mice. Error bars represent standard error of the means. **p < 0.01.
