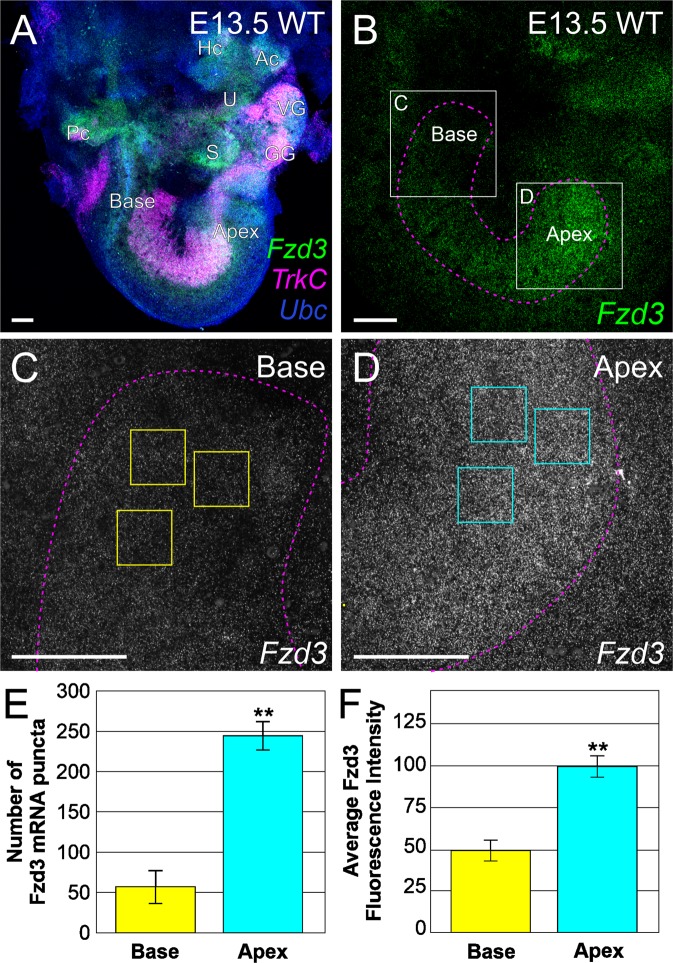
Figure 6.
Fzd3 is expressed as a gradient across the cochlea in auditory neurons. (A) Overview of a wildtype E13.5 ear following RNAscope® fluorescent in situ hybridization showing expression of Fzd3 (green), TrkC (expressed in auditory neurons, magenta), and Ubc (Ubiquitin C, control, blue). Individual puncta represent a single mRNA. U, utricle; S, saccule; Ac, anterior crista; Hc, horizontal crista; Pc, posterior crista; VG, vestibular ganglion; GG, geniculate ganglion. (B) Fzd3 expression at E13.5 in the spiral ganglion showing higher levels of expression in the apex compared with the base. The image shows the collapsed stack of the entire spiral ganglion. The spiral ganglion was outlined following the boundary of TrkC expression (magenta dotted outline). (C) Fzd3 expression in basal afferents (boxed area in B). (D) Fzd3 expression in apical afferents (boxed area in B). C and D were imaged using identical confocal settings. (E) Quantification of individual Fzd3 mRNA puncta in the base and apex following RNAscope®. Puncta were counted with ImageJ software in each of three equal sized squares (50 µm × 50 µm) per region (see yellow/cyan boxes in C and D) in a central Z series image for the base and for the apex of each animal following thresholding. Three animals were quantified. (F) Quantification of fluorescent intensity of Fzd3 mRNA in the base and apex following RNAscope®. Average intensity was determined for each of three equal sized squares (50 µm × 50 µm) per region (see yellow/cyan boxes in C and D) in the collapsed Z series for the base and for the apex of each animal. Three animals were quantified. Error bars represent standard error of the means. **p < 0.01.

