Figure 3.
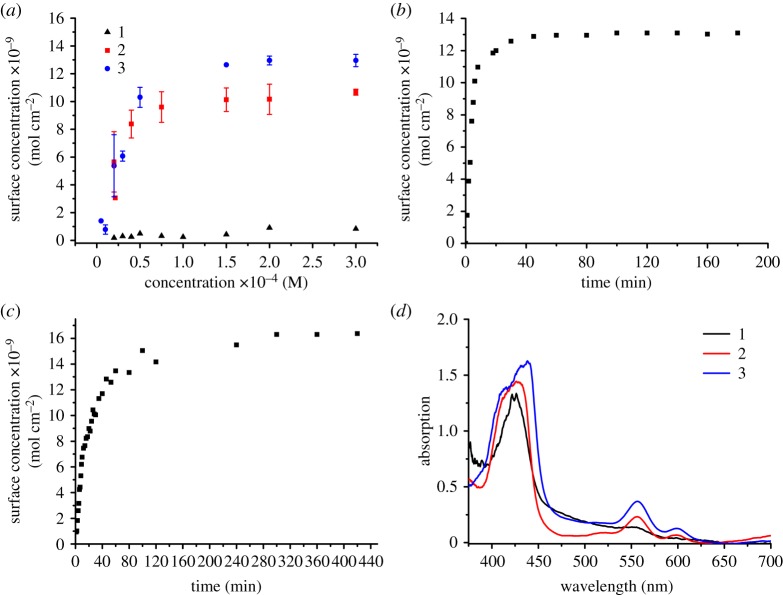
(a) Equilibrium surface concentration of three-layer (1.5 µm thick) NiO films as a function of dye bath concentration (films immersed for 18 h in a THF solution of the dye). The surface concentration was determined using the absorbance of the Soret band (ca 420 nm) at lower dye bath concentrations and the highest energy Q-band (ca 550 nm) at higher concentrations. (b) Surface concentration of a three-layer (1.5 µm thick) NiO film as a function of time (film immersed in a 300 µM THF solution of the dye) for 2. The surface concentration was determined using the absorbance of the Soret band (ca 420 nm) at lower surface concentrations and the highest energy Q-band (ca 550 nm) at higher concentrations. (c) Surface concentration of a three-layer (1.5 µm thick) NiO films as a function of time (film immersed in a 300 µM THF solution of the dye) for 3. The surface concentration was determined using the absorbance of the Soret band (ca 420 nm) at lower surface concentrations and the highest energy Q-band (ca 550 nm) at higher concentrations. (d) UV–visible absorption spectra of 1-3 adsorbed onto NiO (18 h adsorption from a 300 µM THF dye bath).

