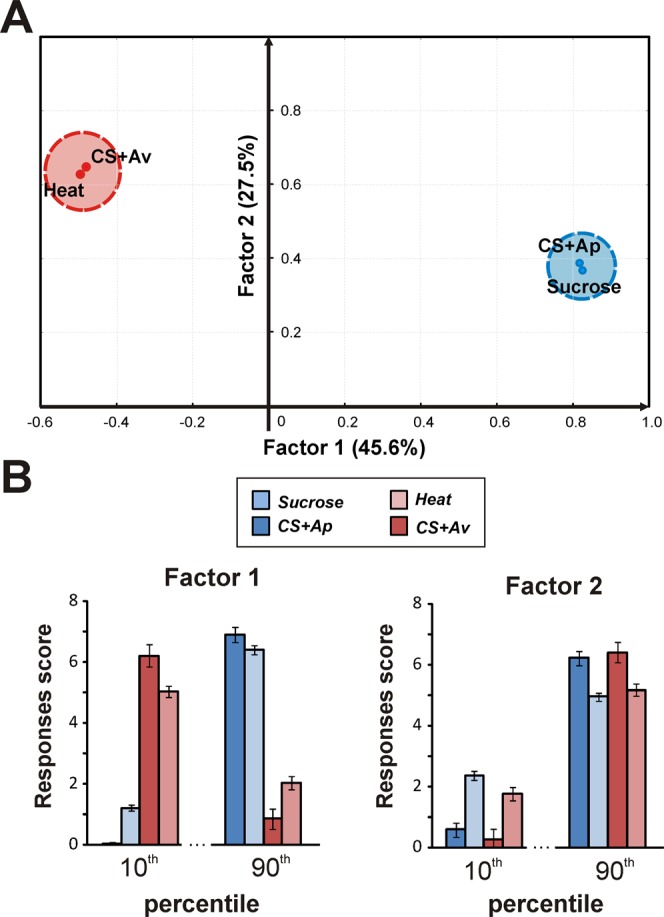
Figure 4.

Factor analysis on appetitive and aversive performances. (A) factor analysis on the 4 response scores (Sucrose: sucrose responsiveness; CS+Ap: appetitive learning score; Heat: heat responsiveness; CS+Av: aversive learning score) measured in 226 individuals. Two main factors with eigenvalues higher than 1 are extracted. Factor 1 (45.6% variance) shows a clear opposite relationship between appetitive and aversive variables. Factor 2 (27.5% variance) is related to differences in average response magnitude among individuals. (B) Response scores (mean ± SEM) of the first and last 10% of the distribution of individuals on Factor 1 or Factor 2.
