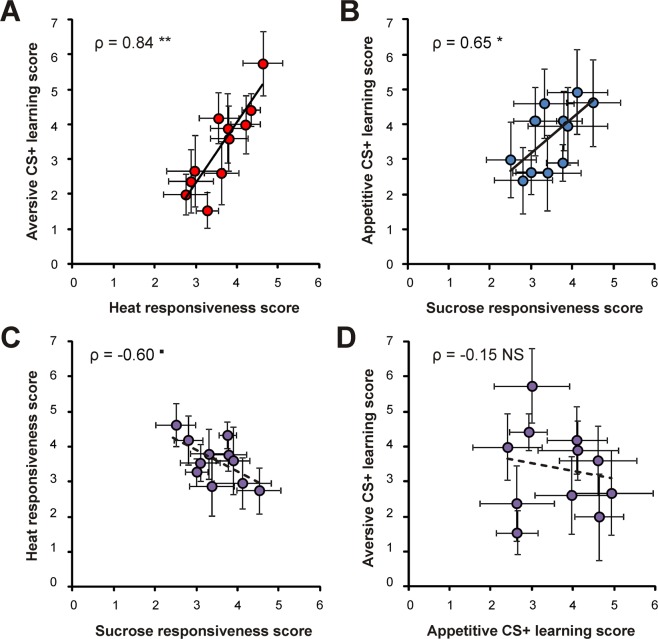
Figure 5.
Patriline influence on the relationship between aversive and appetitive performances. Individual scores are grouped according to each worker’s patriline. (A) Correlation between heat responsiveness and aversive learning scores among patrilines. (B) Correlation between sucrose responsiveness and appetitive learning performance scores among patrilines. (C) Relationship between heat responsiveness and sucrose responsiveness scores at the patriline level. (D) Relationship between appetitive and aversive learning performance scores at the patriline level. (Spearman correlations, ▪p = 0.067, *p < 0.05, ***p < 0.01, NS: not significant; n = 11 patrilines, 9 df, mean ± SEM).

