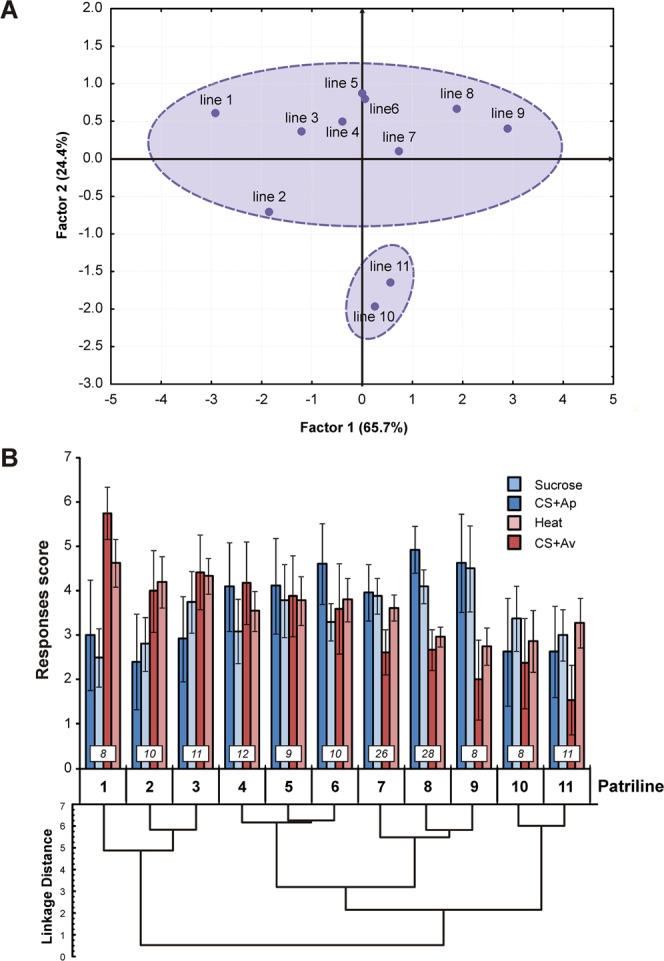
Figure 6.

Multivariate analyses of appetitive and aversive performances at the patriline level. (A) Factor analysis presenting each patriline according to 2 main factors. Factor 1 is a hedonic bias factor, equivalent to Factor 1 in Fig. 4A. Patrilines on the left show high response scores in aversive procedures, while patrilines on the right display stronger appetitive performances. Two patrilines contribute significantly to Factor 2 and exhibit weak scores in both appetitive and aversive procedures. (B) Hierarchical clustering dendrogram (Ward’s method) showing for each patriline its average performance score (mean ± SEM): sucrose responsiveness (light blue), appetitive learning (CS+ Ap, dark blue), heat responsiveness (light red), aversive learning (CS+ Av, dark red). Numbers of individuals are indicated in boxes above each patriline.
