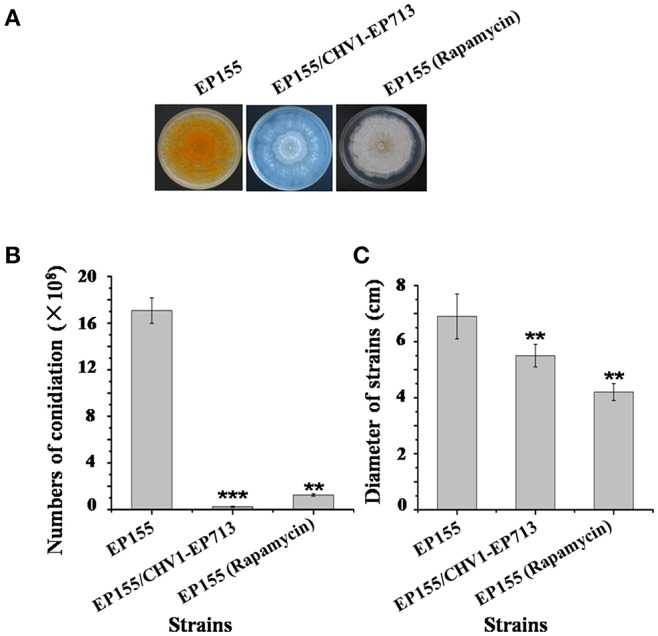
Figure 2.

Sporulation level and growth rates of hypovirus infection and rapamycin treatment on C. parasitica. (A) Phenotypes on PDA. Photo was taken at day 7. (B) Sporulation level. Spores were counted on day 14. (C) Growth rates of EP155, EP155/CHV1-EP713, and EP155 (rapamycin treatment, 60 nM) Growth rate was measured from cultures grown on PDA for 7 days. Values are means ± S.E.M of three independent experiments. ** indicates P < 0.01 and *** indicates P < 0.001, determined by Student's t-test.
