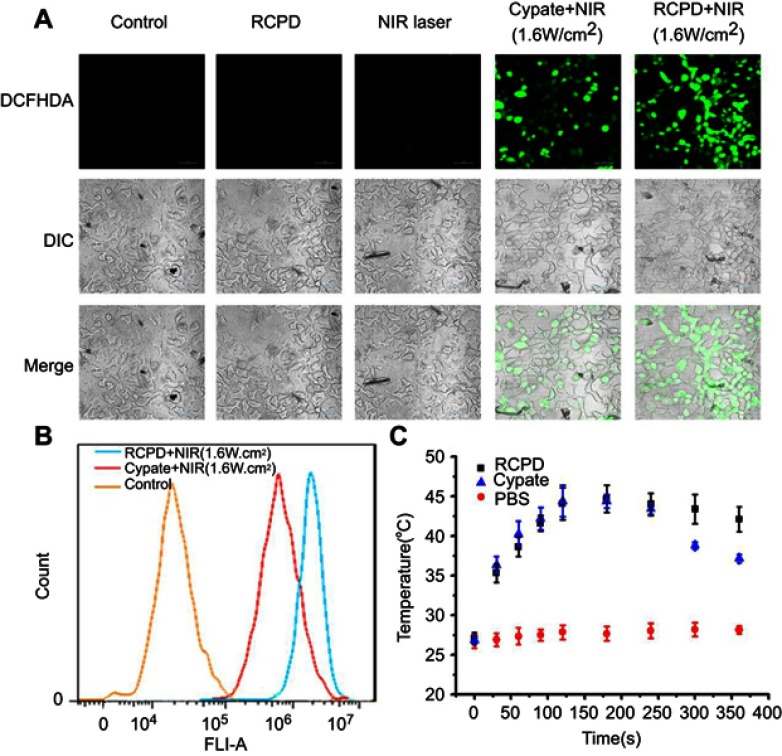
Figure 4.
(A) Confocal images of ROS generation in HepG2 cells at 24 hrs after various treatments. Scale bar is 50 μm. (B) The flow cytometric analysis of intracellular ROS productions in HepG2 cells treated with RCPD or cypate after NIR irradiation (1.6 W/cm2, 5 mins). (C) Temperature viabilities of HepG2 cells treated with PBS, RCPD, or cypate.
Abbreviations: ROS, reactive oxygen species.

