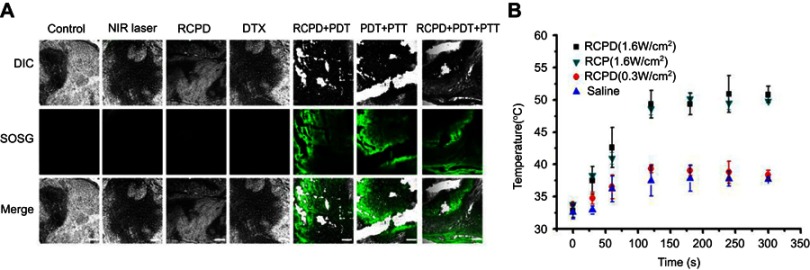
Figure 6.
(A) The confocal images of SOSG-stained sections at 6 hrs after various treatments. Scale bars represent 100 μm. (B) Temperature change curves in tumors exposed to the 808 nm laser at a power density of 0.3 W/cm2 and 1.6 W/cm2 after intravenous injections of saline, RCP, and RCPD.
Abbreviations: SOSG, singlet oxygen sensor green.

