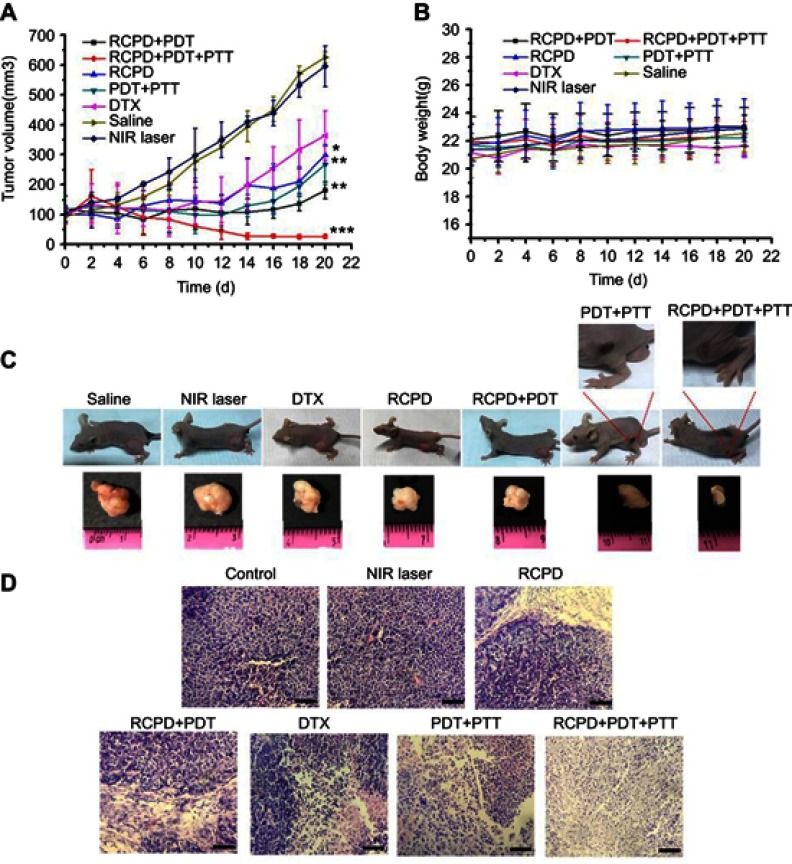
Figure 7.
(A) The tumor growth curves of mice after various treatments. (B) The body weight changes of mice during various treatments. (C) The photos of mice and excised tumors after various treatments. The red circles indicate the tumor size. (D) The images of H&E stained tumor sections after various treatments. Scale bars represent 50 μm. The doses of cypate and DTX in all the above experiments were 6.7 and 5 mg/kg. The laser irradiation was carried out on the tumor at 808 nm at a power density of 0.3 W/cm2 or 1.6 W/cm2 for 5 mins. -*p<0.05, **p<0.01, ***p<0.001 for comparison to the control-.

