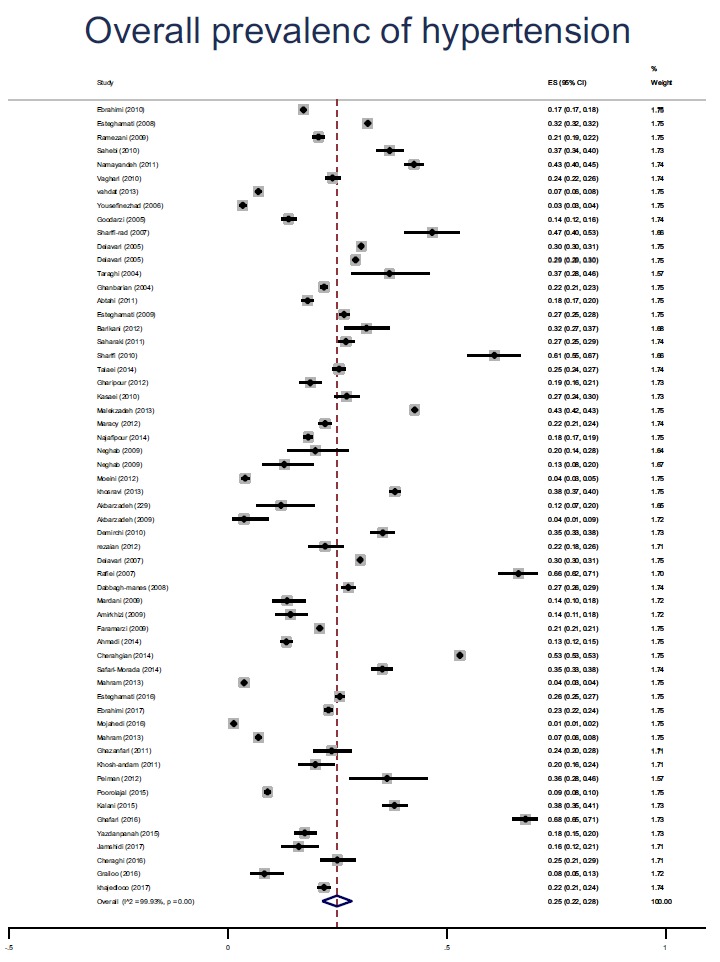
Fig. (2).

The pooled Prevalence of hypertension based on the studies in Iran. The 95% confidence range for each study is in the form of horizontal lines around the original average. The dotted line in the middle represents the overall prevalence estimates. Diamond shape represents the overall prevalence is assured.
