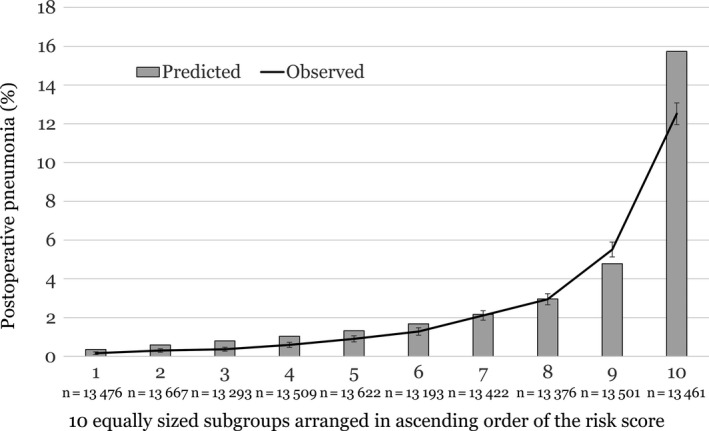
Figure 3.

Calibration of the postoperative pneumonia model. Bar charts represent mean rate for the predicted events. Line chart represents those for the observed events, and the error bars represent 95% CI of the observed events. The risk score is calculated using Σ [βi × X i]. βi is the coefficient of the variable Xi in the logistic regression equation. This figure represents how well the rates of the predicted events matched those of the observed events according to the patient risk subgroups
