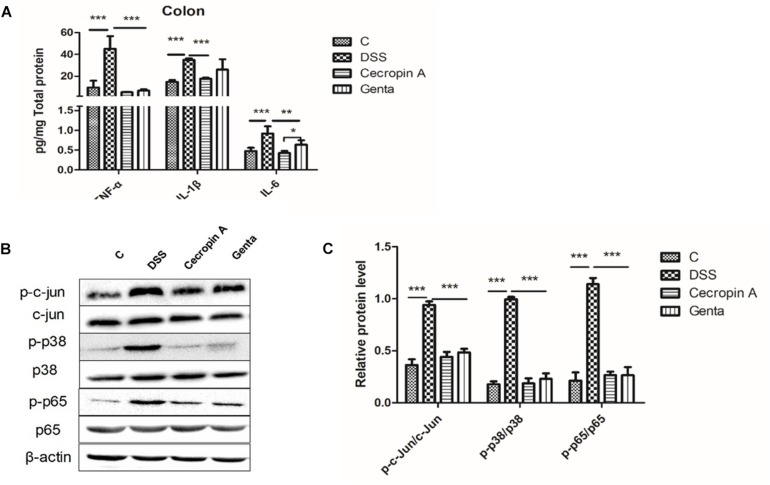
FIGURE 4.
Abundances of pro-inflammatory cytokines, and phosphorylated proteins in the MAPK and NF-κB signaling pathways in the control, DSS, cecropin A and gentamicin groups in mice. (A) abundances of TNF-α, IL-1β, and IL-6, n = 8; (B,C) the phosphorylation levels of p38, c-jun, and NF-κB p65 analyzed by Western blotting, n = 3. C: the control group; Genta: the mice were pretreated by 2.5% DSS for 5 days and then received intraperitoneal injection of 5 mg/kg body weight gentamicin. Cecropin A: the mice were pretreated by 2.5% DSS for 5 days and then received intraperitoneal injection of 15 mg/kg body weight cecropin A. DSS: the mice were treated by 2.5% DSS. The control group and DSS group received intraperitoneal injection of saline. The data are mean ± SEM and analyzed by one-way ANOVA. *P < 0.05, ∗∗P < 0.01, and ∗∗∗P < 0.001.

