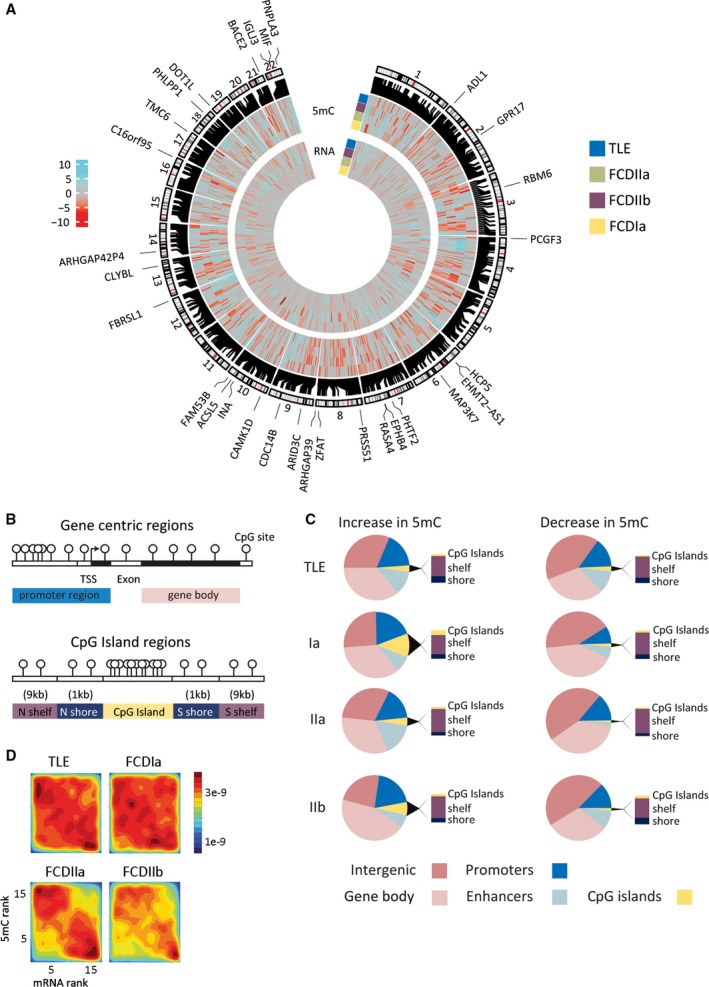
Figure 4.

A, Whole genome sequencing detected strong changes in DNA methylation and messenger RNA (mRNA) expression that distinguished epilepsy subtypes. Differential regions are shown on the human genome autosomes. The outer subtype ring summarizes hypermethylation (cyan) and hypomethylation events (red) in the individual epilepsy groups, that is, focal cortical dysplasia (FCD) Ia, FCD IIa, FCD IIb, and temporal lobe epilepsy (TLE), compared to the nonepilepsy control group showing 958 unique loci with a cutoff of P < 1e‐4. The inner subtype ring summarizes mRNA changes in the epilepsy groups compared to the nonepilepsy control group. Genomic locations of differentially methylated regions (DMRs) and differentially methylated genes (DMG)s are shown. Heatmap scale shows differential methylation and expression changes between epilepsy and nonepilepsy groups expressed as the –log10 P value. The outer circle of genes is the top 30 DMG. B, Graphical representation of genomic features and CpG Islands, shelves, and shores. Regions are: promoter (±2 kb from TSS), gene body, CpG islands (CGIs), and CpG island shores (±1 kb from CGI) and shelves (±1‐9 kb from CGI). C, The majority of subtype DMRs were colocated with functional genomic elements. Distribution of identified DMRs clustered across genomic features including gene promoter region, gene bodies, CGIs and CGI shores and shelves. D, Rank‐rank density plot showing significant inverse correlation of DNA promoter methylation and gene expression in all subtype pathologies. Hypermethylation was associated with reduced gene expression (upper left corner), whereas hypomethylation was primarily found in upregulated genes (lower right corner)
