Figure 2.

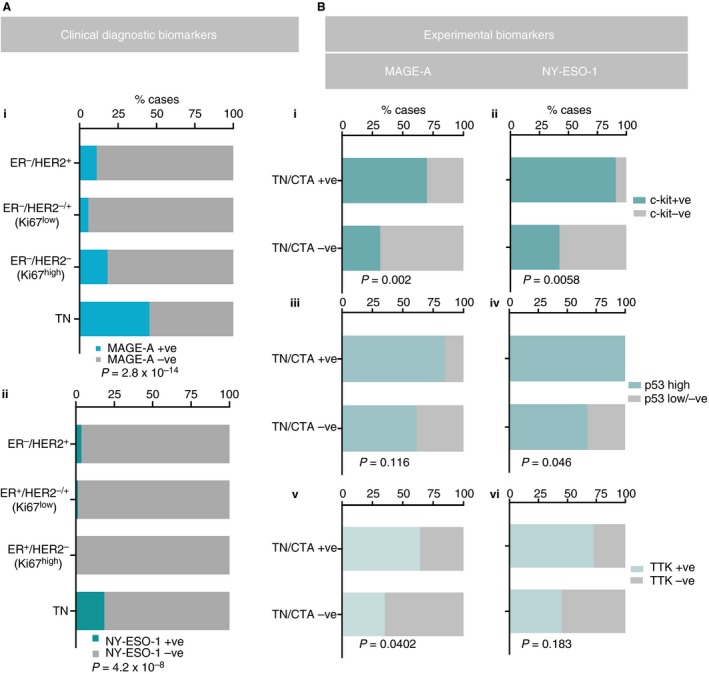
A,B, Chi‐square or Fisher's exact test analysis of associations between expression of MAGE‐A/NY‐ESO‐1 and clinical diagnostic or experimental biomarkers (c‐Kit, p53, and TTK1).

A,B, Chi‐square or Fisher's exact test analysis of associations between expression of MAGE‐A/NY‐ESO‐1 and clinical diagnostic or experimental biomarkers (c‐Kit, p53, and TTK1).