
Figure 4.
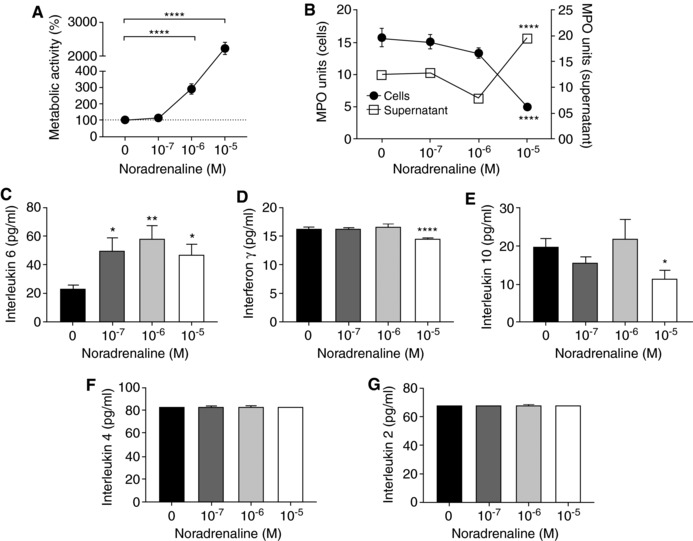
The effect of prolonged NA treatment on neutrophil function. (A) The metabolic activity of neutrophils treated with NA for 24 h as measured by the MTT assay. Data represent mean ± sem. N = 8. ****P < 0.0001 compared to control, One‐way ANOVA with Bonferroni or Tukey's multiple comparisons test. (B) MPO activity of neutrophils (2 × 10⁶) treated with or without NA for 24 h and the supernatant (70 μl) aspirated from these cells were quantified. Data represent mean ± sem. N = 8. ****P < 0.0001 compared to control, One‐way ANOVA with Bonferroni or Tukey's multiple comparisons test. Measurement of interleukin 6 (C), IFN‐γ (D), IL‐10, (E) IL‐4 (F), and IL‐2 (G) released into the cell media following 24 h of NA challenge, quantified using a cytometric bead array. Data represent mean ± sem. N = 8. *P < 0.05, **P < 0.01, ****P < 0.0001, One‐way ANOVA with Tukey's multiple comparisons test