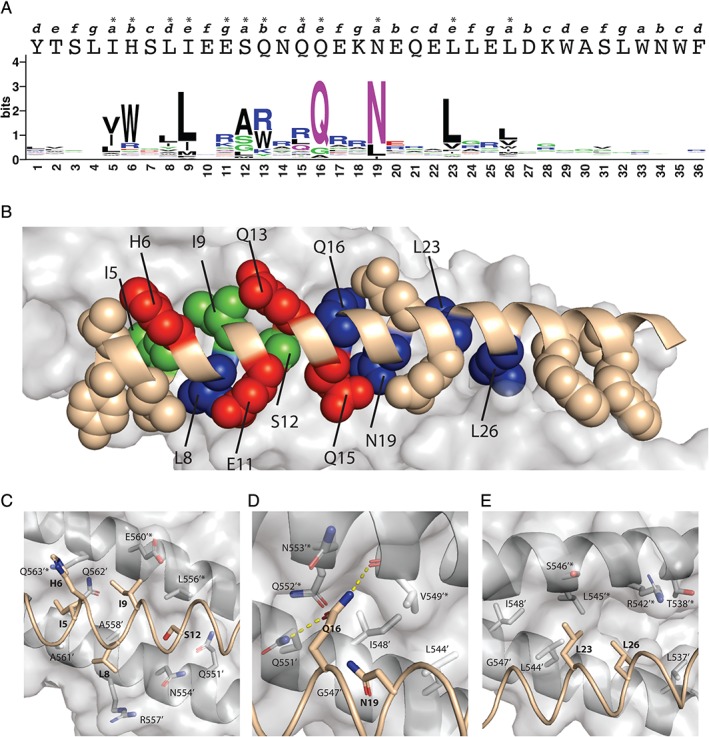
Figure 3.

Structural rationalization of the T20 saturation scan. (a) Sequence logo plot of the normalized fraction of residues occurring at each scanned position of T20 following selection for binding to 5HB. In the sequence logo, amino acids are colored according to their chemical properties: green, polar (G, S, T, Y, C, Q, N); blue, basic (K, R, H); red, acidic (D, E); and black, hydrophobic (A, V, L, I, P, W, F, M). The primary sequence of T20 is shown above the sequence logo in upper case letters. The heptad position for each residue is shown above the T20 sequence in lower case italics and asterisks (*) indicate conserved residues with bit values >1.2. (b) Structure of post‐fusion gp41 core (PDB ID code 2X7R). The structure corresponding to 5HB is shown as a gray surface, and that corresponding to the T20 main chain is shown as a ribbon colored in wheat. The side chain atoms of 20 residues in T20 that are within contact distance to 5HB are shown as spheres colored wheat, blue, green, or red if they were non‐conserved or conserved as wt, homologous, or nonhomologous residues, respectively. (c–e) Details of the molecular interactions between T20 and 5HB, with close ups of: (c) the amino‐terminal hydrophobic epitope, (d) central hydrophilic dyad, and (e) carboxyl‐terminal hydrophobic dyad. Hydrogen bonds are represented by dashed yellow lines. Figure 3(a) was generated using WebLogo32 and Figure 3(b‐e) was generated using Pymol.33
