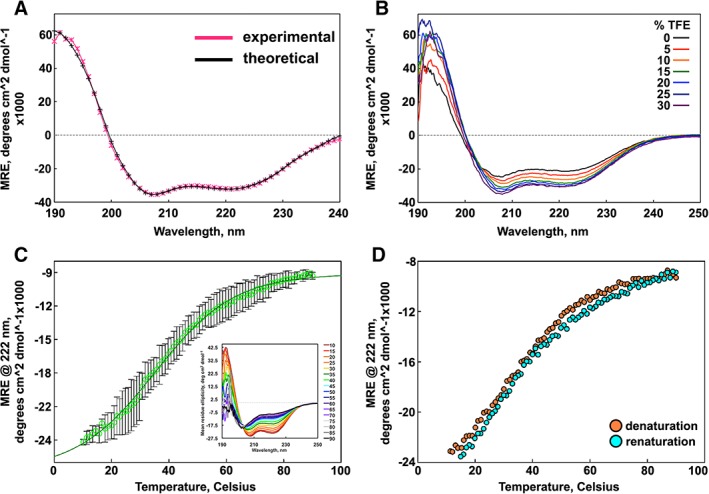
Figure 1.

Secondary structure and stability of SIKE. (A) CD spectra of 386 nM SIKE ( ) in 5 mM NaH2PO4, pH 8, and theoretical fit to data (*; −) from DichroWeb CONTINLL analysis are indicative of alpha helical content. (B) Titration of TFE (0%–30%) into 464 nM SIKE delineate an increase in alpha helical content (208 and 222 nm minima) up to 25% TFE. (C) Thermal melt of SIKE at 773 nM (
 ) monitored at 222 nm shows a gradual loss of alpha helical content. Average of three independent measurements is shown with error depicted as standard deviation. Fit to a sigmoidal four‐parameter model (
 ) yielded a cooperativity factor of 13.8 ± 0.5 consistent with gradual loss of structure rather than a sharp transition and a T
m of 35.1°C ± 0.6°C. First derivative analysis of the curve yielded a maxima (T
m) of 29.7°C (not shown). Inset: CD spectra of SIKE at increasing T, colored red to black. (D) Thermal denaturation was reversible. All data were collected in 5 mM NaH2PO4, pH 8 buffer. Spectra are representative of a minimum of three independent measurements.
