Figure 2.

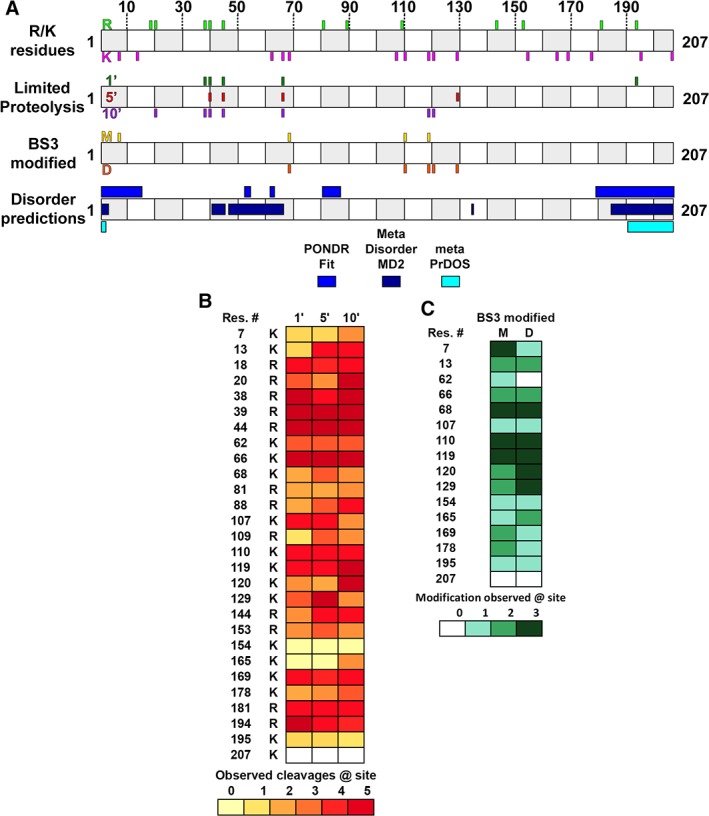
Dynamic regions of SIKE intersect with predicted regions of disorder. (A) Cartoon diagram shows SIKE primary sequence with alternating open and gray boxes demarcating 10 residue lengths. R/K residues: Positions of 12 arginine residues in SIKE are shown above cartoon in green and 16 lysine residues are shown below cartoon in magenta. Experimental data will align with these sites to identify residues. LP: SIKE was subjected to LP with trypsin for 1–10 min and cleavage sites identified by LC–MS/MS. Top shows 1′ cleavage sites in forest green; center shows 5′ cleavage sites in red; bottom shows 10′ cleavage sites in purple. BS3 modified: Lysines monofunctionally modified by BS3 in the excised monomer (M) gel band are shown on top (gold) and in the excised dimer (D) gel band are shown at the bottom (orange). Disordered predictions: Disordered regions were predicted by PONDR FIT, MetaDisorderMD2, and metaPrDOS as indicated. Highlighted regions had residues with predicted disorder parameter ≥0.5 threshold for each program—PONDR FIT: 1–15, 52–54, 61–63, 80–87, 179–207; MetaDisorderMD2: 1–3, 40–44, 46–65, 134–135, 184–207; metaPrDOS: 1–2, 191–207. (B) Heatmap of LP experiments for 1′, 5′, and 10′ data shows the relative cleavage across available K/R residues. Colors range from light yellow (0 cleavages observed) to brick red (cleavage observed in all experiments). K207 is coded white as this is the C‐terminus. (C) Heatmap of BS3 modification experiments for monomer and dimer species shows the relative modification across available K residues. The N‐terminus was not included as no modification was observed at this position. Colors range from light green (0 modifications observed) to deep green (modification observed in all experiments).
