Figure 2.
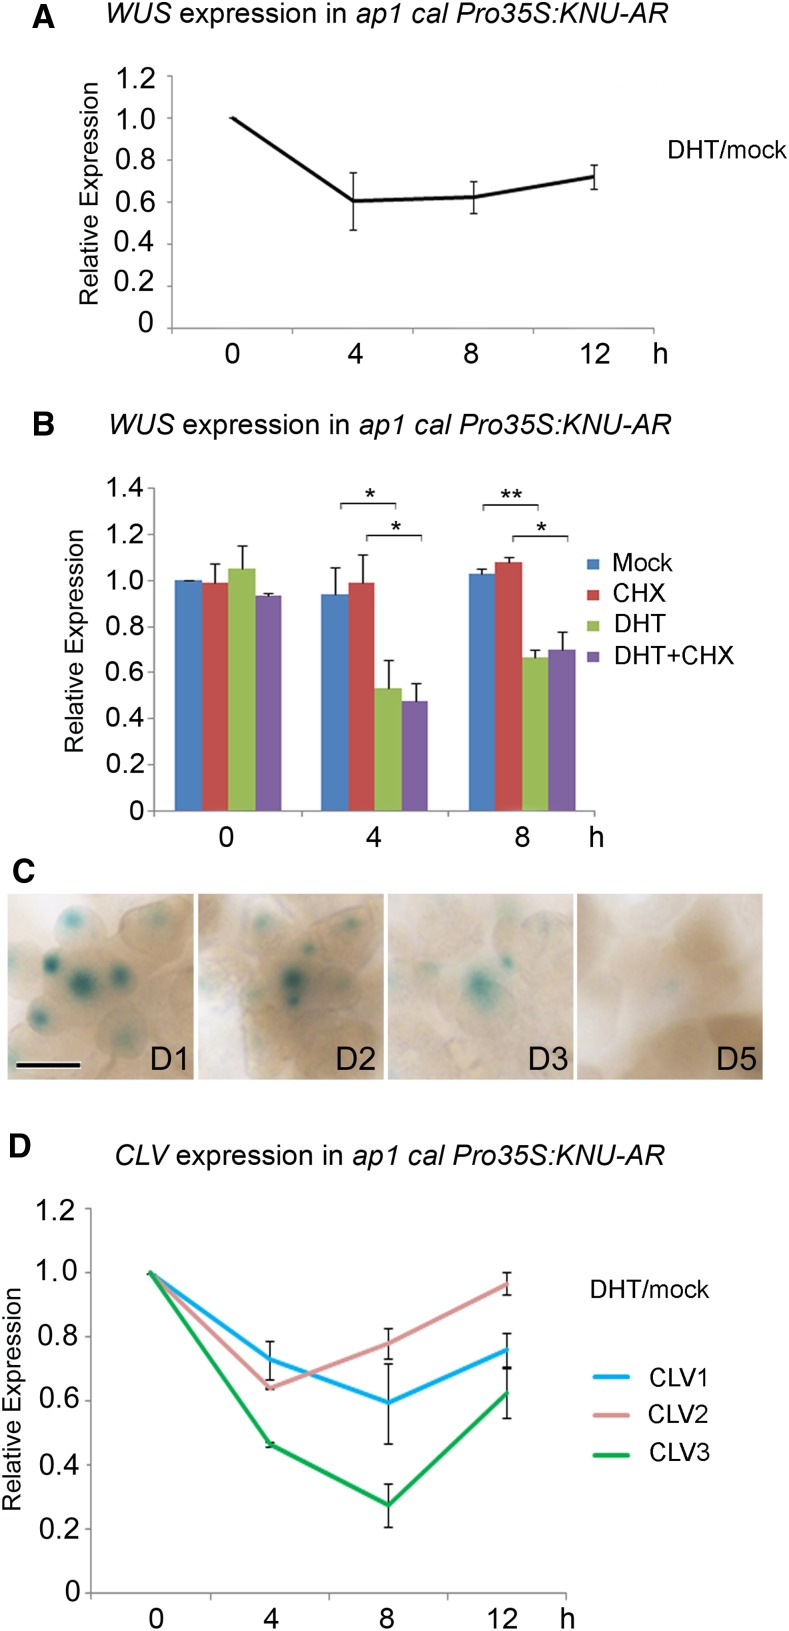
Repression of WUS and CLV Genes by KNU.
(A) and (B) WUS expression in ap1 cal Pro35S:KNU-AR after a single DHT treatment, as measured by RT-qPCR. Tip41-like (At4g34270) served as the internal control. Asterisks indicate significant differences between samples treated with different chemicals (*P < 0.05 and **P < 0.01, Student’s t test).
(C) GUS staining in ProWUS:GUS Pro35S:KNU-AR inflorescences from day 1 (D1) to day 5 (D5) after initial DHT treatment (day 0). The ProWUS:GUS Pro35S:KNU-AR inflorescences were treated with 100 nM DHT three times at 1-d intervals. Bar, 100 μm.
(D) Transcript levels of CLV1, CLV2, and CLV3 in ap1 cal Pro35S:KNU-AR inflorescences after a single DHT treatment. Tip41-like (At4g34270) served as the internal control. Error bars in (A), (B), and (D) represent the sd of two biological replicates with three technical replicates each.

