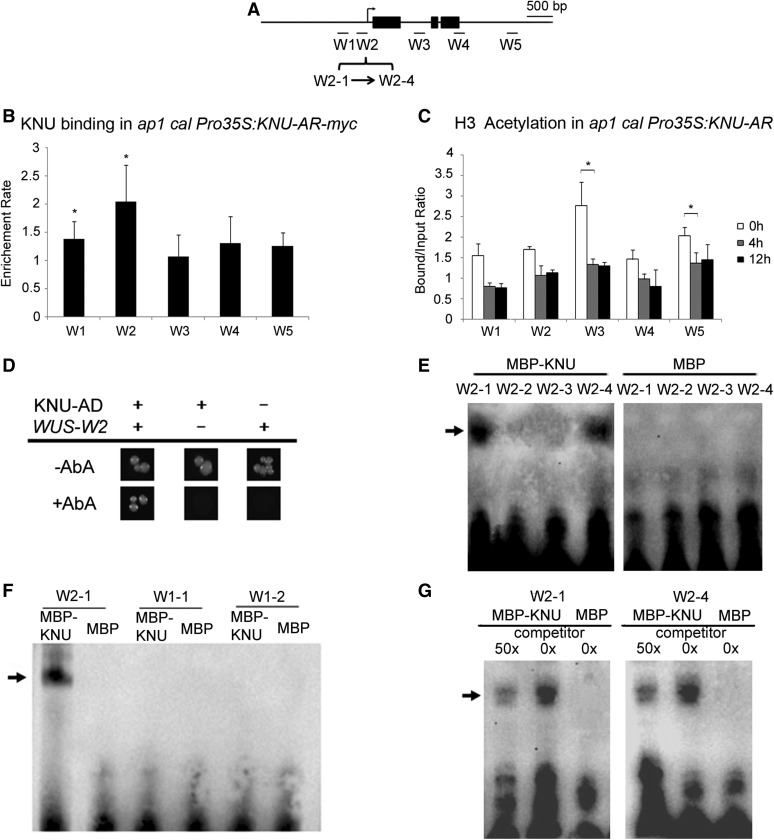
Figure 3.
KNU Binds to the WUS Promoter.
(A) Schematic diagram showing the WUS locus and the promoter region used for ChIP assays, yeast one-hybrid assays, and EMSAs in (B) to (G). Black rectangles represent coding regions. Fragments: W1-1, −648 ∼ −583; W1-2, −582 ∼ −518; W2-1, −308 ∼ −265; W2-2, −264 ∼ −213; W2-3, −212 ∼ −175; W2-4, −174 ∼ −125 bp upstream from the ATG start codon.
(B) ChIP assay using ap1 cal 35S:KNU-AR-3myc inflorescences harvested 48 h after DHT treatment. Nuclear protein complexes were immunoprecipitated with anti–c-Myc agarose beads, and the enriched DNA was used for qPCR analysis. The y axis shows relative enrichment using anti-HA agarose beads as a control. Mu-like transposons served as a negative control locus and were set to 1. Asterisks indicate significant differences between the control locus (MU) and different primer sets on WUS (*P < 0.05, Student’s t test).
(C) ChIP assay using ap1 cal Pro35:KNU-AR inflorescences harvested at 0, 4, and 12 h after a single 100 nM DHT treatment. The y axis shows the calibrated relative ratio of bound DNAs to input DNAs after IP. Mu-like transposons served as a negative control locus and were set to 1. Error bars represent the sd of three (B) and two (C) biological replicates with three technical replicates each. Asterisks indicate significant differences between different time points at certain primers sets of WUS (*P < 0.05, Student’s t test).
(D) Yeast one-hybrid assays demonstrate that KNU associates with the WUS promoter W2 region. AbA, Aureobasidin A.
(E) to (G) EMSAs confirm that KNU binds to the W2-1 and W2-4 fragments. The arrow indicates the DNA–protein complex. Nonlabeled oligonucleotides were used as competitors. MBP was used as a negative control.

