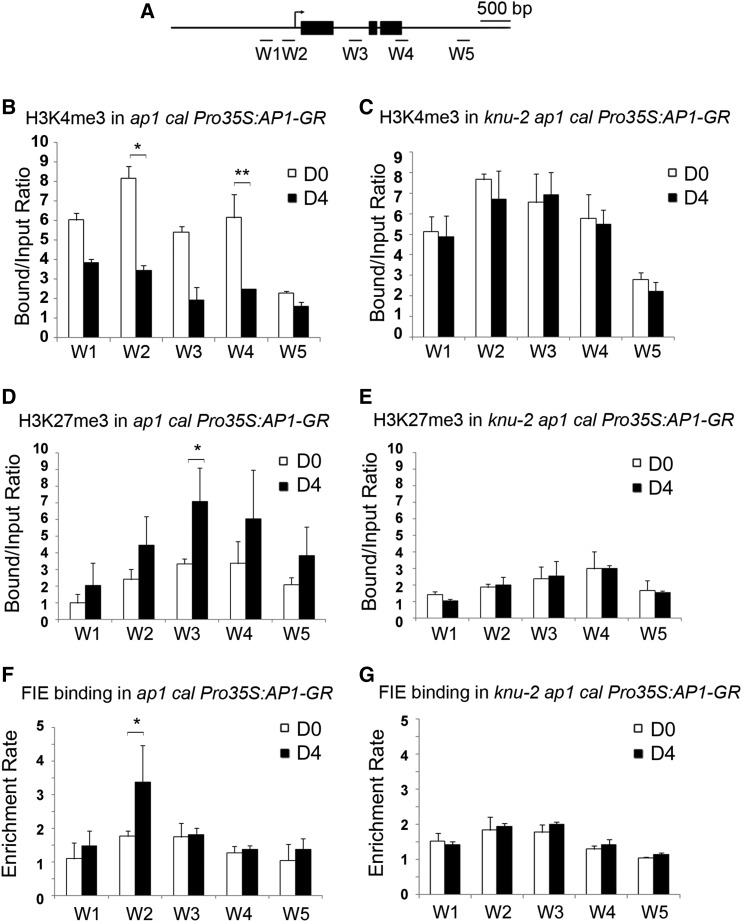
Figure 6.
Change of WUS Chromatin Status Is KNU Dependent.
(A) Schematic diagram showing the WUS locus used for ChIP assays in (B) to (G).
(B) to (G) The ap1 cal Pro35S:AP1-GR (see [B], [D], and [F]) and knu-2 ap1 cal Pro35S:AP1-GR (see [C], [E], and [G]) inflorescences 0 and 4 d after a single treatment with DEX were sampled.
(B) and (C) H3K4me3 analysis.
(D) and (E) H3K27me3 analysis. The y axis shows the calibrated relative ratio of bound DNAs to input DNAs after IP.
(F) and (G) ChIP assays for FIE binding. The y axis shows the relative enrichment using IgG as a control. Mu-like transposons served as a negative control locus, and the relative bound/input ratios or relative enrichment rates on MU were set to 1. Error bars represent the sd of three (see [B], [D], and [F]) and two (see [C], [E], and [G]) biological replicates with three technical replicates each. Asterisks indicate significant differences between day 0 (D0) and day 4 (D4) at certain primers sets of WUS (*P < 0.05 and **P < 0.01, Student’s t test).

