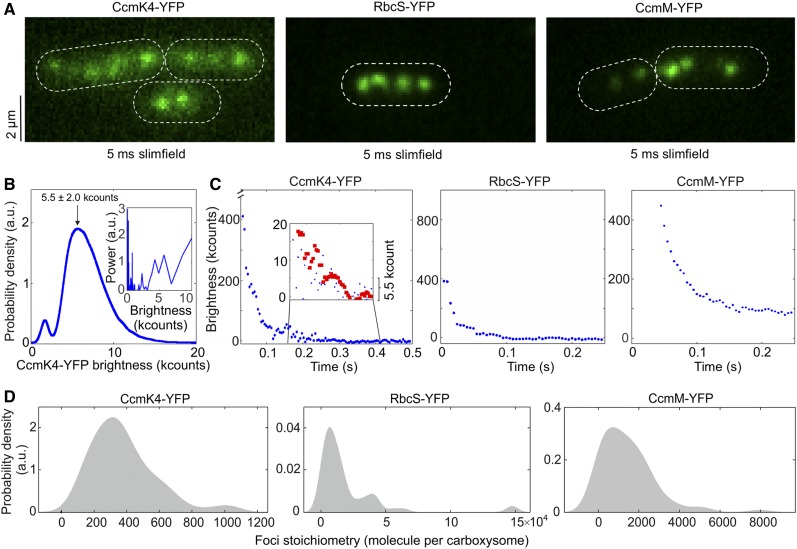
Figure 1.
Slimfield Quantification of Cells Grown under Ambient Air/Moderate Light Air/ML Conditions.
(A) Averaged Slimfield images of YFP fluorescence (green) over 5 frames of strains expressing shell component CcmK4-YFP, the interior enzyme RbcS-YFP, and the shell-interior linker protein CcmM-YFP. White dashed lines indicate cell body outlines.
(B) Distribution of the intensities of automatically detected foci from the end of photobleaching, corresponding to the characteristic intensity of in vivo YFP. Inset shows the Fourier spectrum of ‘overtracked’ foci, tracked beyond photobleaching, showing a peak at the characteristic intensity. a.u., Arbitrary units.
(C) Representative fluorescence photobleaching tracked at ultra-fast speed. The CcmK4 plot shows an inset ‘zoomed in’ on lower intensity range with step-preserving Chung-Kennedy filtered data in red, showing individual photobleaching steps clearly visible at the characteristic intensity. Brightness (kcounts), counts measured per camera pixel multiplied by 1000.
(D) Distribution of YFP copy number detected for individual carboxysomes in corresponding mutants, rendered as kernel density estimates using standard kernel width. Heterogeneity of contents was observed, and a “preferable” copy number, represented by kernel density peak values, could be determined. Statistics of copy numbers (Peak value ± HWHM) are listed in Table 1 for ML conditions. The corresponding Slimfield images and histogram for complete strain sets are shown in Supplemental Figure 3.

