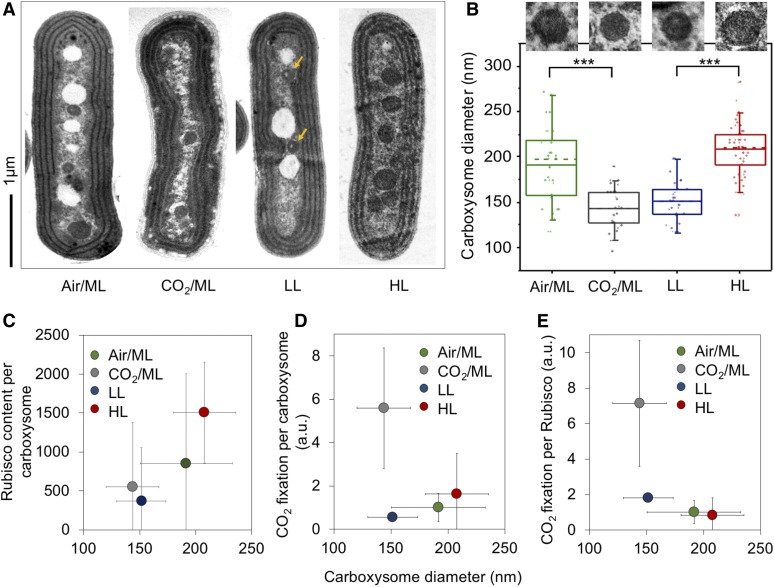
Figure 4.
Variations of the Carboxysome Size and Carbon Fixation under Air/ML, CO2, LL, and HL.
(A) Thin-section EM images showing individual carboxysomes in the Syn7942 wild-type cells under Air/ML, CO2, LL, and HL treatments. Yellow arrows indicate the carboxysomes with spaces of low protein density under LL. More EM images are shown in Supplemental Figure 9. Scale bar = 1 μm.
(B) Changes in the carboxysome diameter under Air/ML, CO2, LL and HL measured from EM (n = 33, 25, 27, and 51, respectively), with representative carboxysome images depicted above. Dashed lines indicate medians, and solid lines indicate means. Differences in the carboxysome diameter are significant between CO2 and air (P = 1.92 × 10⁻¹⁴) and between LL and HL (P = 8.29 × 10⁻⁷), indicated as ***.
(C) Correlation between the carboxysome size and the Rubisco content per carboxysome under Air/ML, CO2, LL, and HL.
(D) Correlation between the carboxysome size and CO2 fixation per carboxysome. a.u., Arbitrary units.
(E) Correlation between the carboxysome size and CO2 fixation per Rubisco of the carboxysomes. Carboxysome diameters and CO2 fixation are presented as average ±sd, whereas the carboxysome total protein content and Rubisco content are shown as Peak value ± HWHM.

