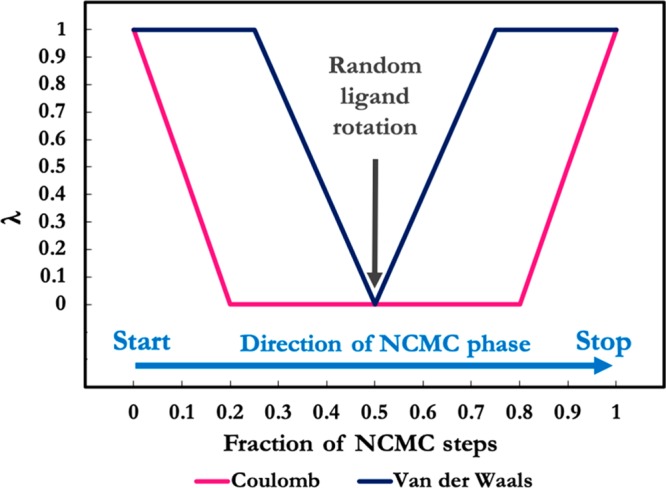
Figure 2.

Scaling of nonbonded interactions of the ligand with respect to λ over the course of NCMC steps. At λ = 1 the ligand is fully interacting, whereas at λ = 0 the interactions of the ligand are turned off completely. The relaxation MD part is not included in this figure. Adapted from Gill et al.33
